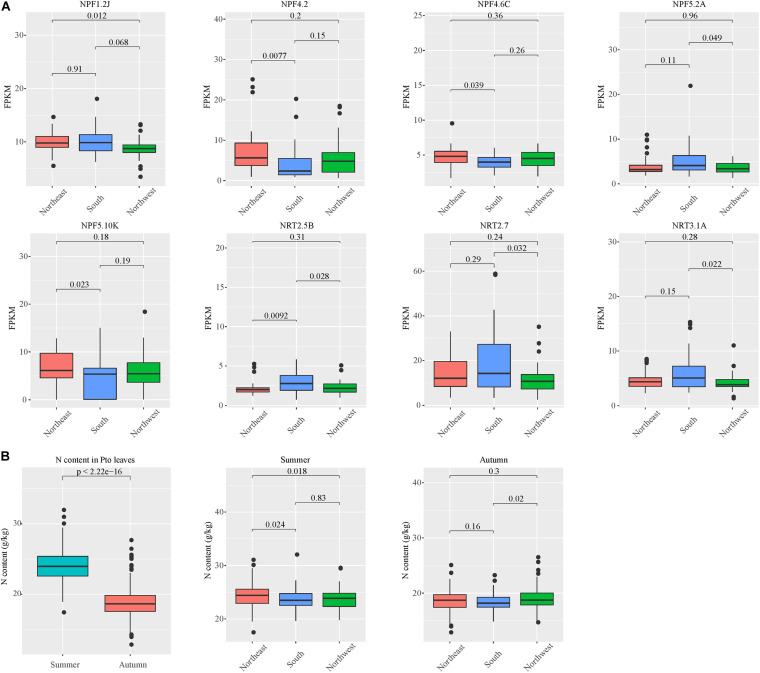
FIGURE 3.
Population expression patterns of NRT genes and leaf nitrogen content among climatic zones and seasons. (A) Individual plants were divided into three main climate zones, namely the northeast, northwest and south. The ANOVA method in R software was used to identify significant differences in gene expression levels. The abscissa is the climate zone, the ordinate is FPKM, and the significance level is denoted above. (B) Leaf nitrogen content between climatic zones and seasons. The abscissa is the season or climate zone, the ordinate is N content (g/kg), and the significance level is denoted above each pair of zones.

