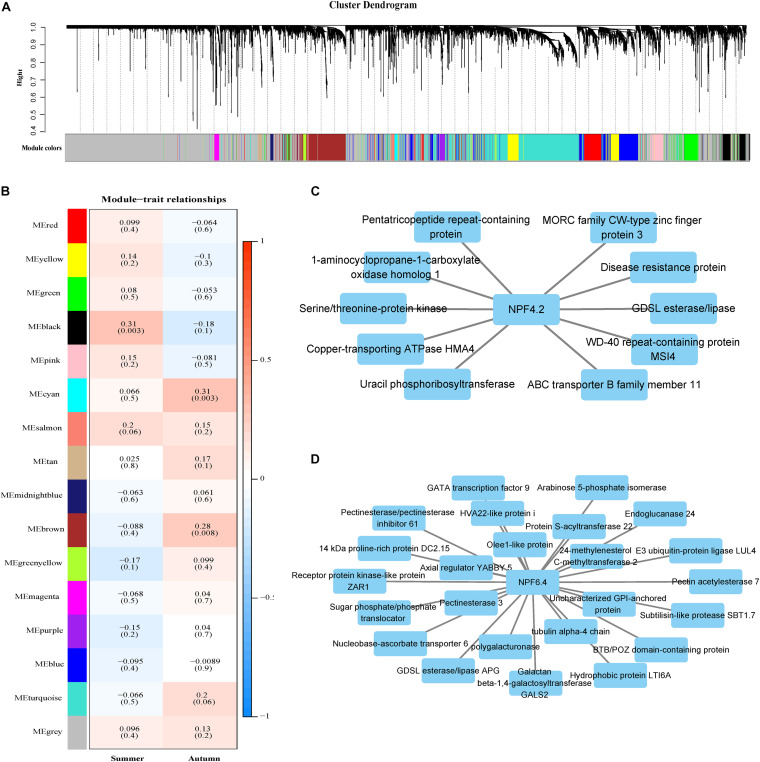
FIGURE 5.
Gene modules identified through weighted gene co-expression network analysis (WGCNA). (A) Gene dendrogram obtained through dissimilarity clustering based on consensus topological overlap, with the corresponding module colors indicated by the row color. Each colored row represents a color-coded module which contains a group of highly connected genes. A total of 25 modules were identified. (B) Relationships among modules and leaf nitrogen content during two seasons. Each row in the table corresponds to a module, and each column to a season. The module name is shown on the left side of each cell. Numbers in the table represent the correlations between the corresponding module eigengenes and stage, with p values listed below the correlations in parentheses. The table is color-coded to represent correlation strength according to the color legend. The intensity and direction of each correlation are indicated on the right side of the heatmap (red, positively correlated; blue, negatively correlated). (C) Genes with strong correlations (p < 10E-05) with the NPF4.2 gene in the black module. (D) Genes with strong correlations (p < 10E-30) with the NPF6.4 gene in the brown module.

