. 2020 Jun 15;35(5):547–555. doi: 10.1177/0269881120926673
© The Author(s) 2020
This article is distributed under the terms of the Creative Commons Attribution 4.0 License (https://creativecommons.org/licenses/by/4.0/) which permits any use, reproduction and distribution of the work without further permission provided the original work is attributed as specified on the SAGE and Open Access page (https://us.sagepub.com/en-us/nam/open-access-at-sage).
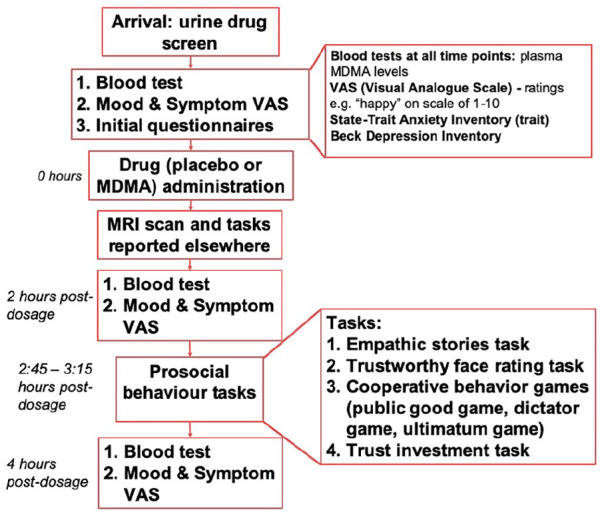
Figure 1.

Flowchart to represent the order of events on each acute session day.
