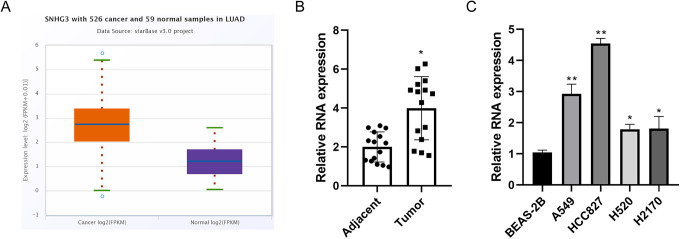
Figure 1.
Abnormal high expression of SNHG3 in lung cancer tissues and cells. A, Online analysis of the difference of SNHG3 mRNA expression in lung adenocarcinoma and normal tissues using Starbase database. B, Quantitative PCR analysis of SNHG3 in 15 pairs of NSCLC tissues and corresponding adjacent tissues. C, Quantitative analysis of the relative expression of SNHG3 in various cells using PCR. Data are the means ± SD of 3 independent experiments. *P < 0.05, **P < 0.01 compared with adjacent tissues group or BEAS-2B cell group.

