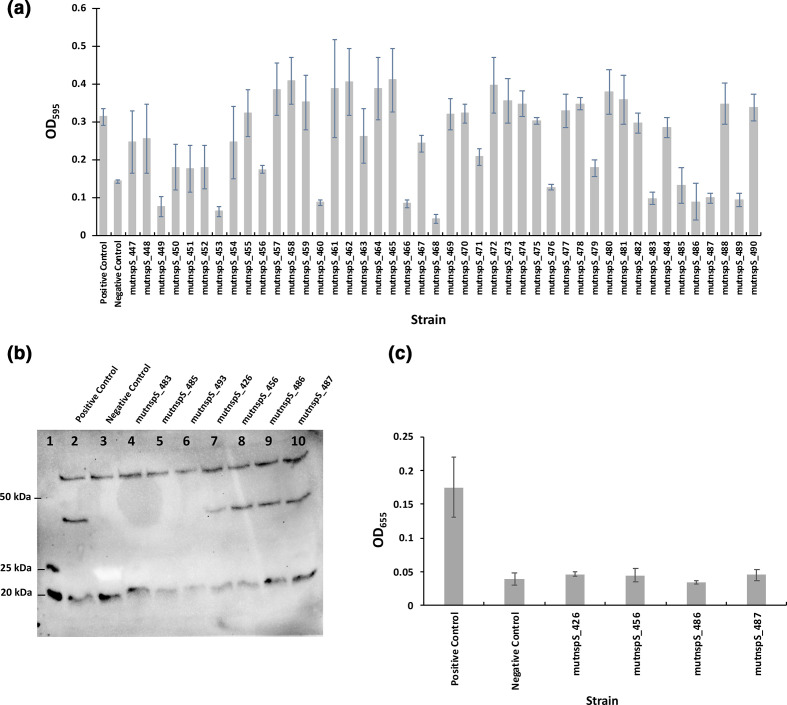
Fig. 3.
(a) Initial analysis of biofilm formation. Crystal-violet staining was used to analyse biofilm formation for each mutant clone. This graph shows a subset of 44 mutant clones. The positive control is V. cholerae ΔnspS with pACYC184::nspS-V5 and the negative control is V. cholerae ΔnspS with pACYC184. Three positive and three negative controls were used with each plate; the averages of these values are shown on the graph. The error bars represent standard deviations of three technical replicates. (b, c) Analysis of NspS protein expression and tertiary screen of biofilm formation. (b) Example Western-blot analysis with a ladder in lane 1 and positive and negative controls respectively in lanes 2 and 3. The positive control is V. cholerae ΔnspS with pACYC184::nspS-V5 and the negative control is V. cholerae ΔnspS with pACYC184. Lanes 4–10, seven mutant clones identified from two crystal-violet biofilm assays as having low biofilm formation. This image was taken with a BIO-RAD Molecular Imager Gel Doc XR System and manually exposed for 2 min. (c) Graph of biofilm formation for the four mutant clones from (b) that showed NspS protein expression. Three biological replicates were analysed in triplicate per mutant clone for biofilm formation. The positive and negative controls are the same as in (a). Error bars show standard deviations of three biological replicates. Only clones that showed protein expression in the Western blot were further tested for biofilm formation, e.g. mutnspS_426, mutnspS_456, mutnspS_486 and mutnspS_487 from (b).

