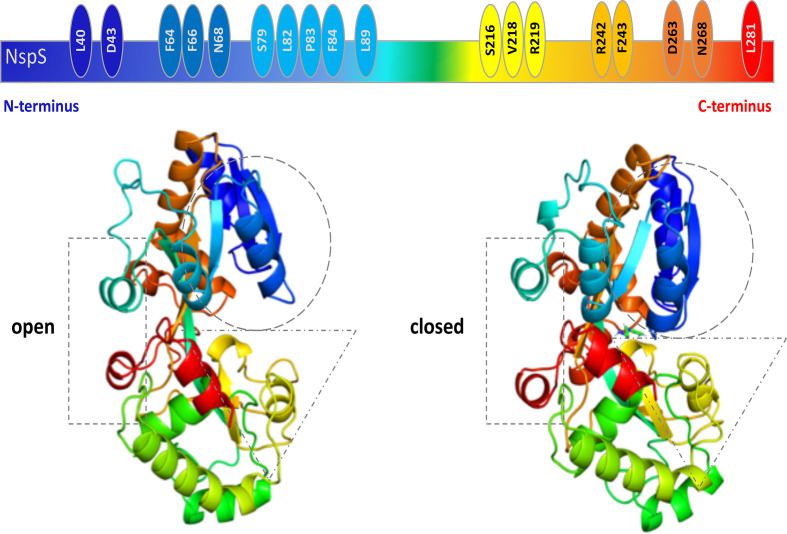
Fig. 6.
Comparison of conformational changes between open and closed NspS homology models and location of single mutants. (a) Cartoon representation of the linear NspS sequence with identities of residues found in single-missense mutants is shown above ribbon representations of the open and closed models of NspS; all are coloured as a rainbow from N-terminus (dark blue) to C-terminus (red). Dotted shapes indicate regions undergoing movement between the two conformations.

