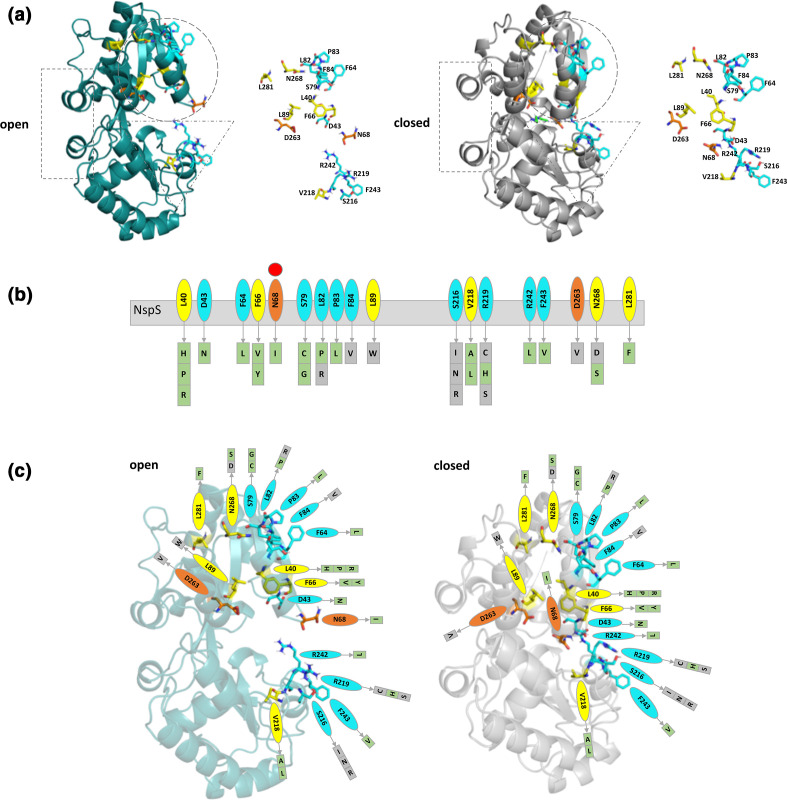
Fig. 7.
Categorization of single-mutant residues based on their location on the NspS homology model. (a) Ribbon diagrams of NspS homology models in open (teal) and closed (grey) conformations. Dotted shapes indicate regions that move between the two conformations. The ribbon representation of the NspS homology model in the closed conformation contains docked norspermidine (green sticks). Individual residues identified by mutation are shown adjacent to the ribbon diagrams. (b) Cartoon of linear NspS amino acid sequence with residues of single-missense mutants in coloured bubbles. Amino acid substitutions for each site are in boxes beneath the primary sequence cartoon. Each box is coloured based on mutant responsiveness to exogenous norspermidine: green boxes are responsive and grey boxes are non-responsive (see Fig. 8 for more detail). The red circle above N68 indicates this residue exhibits a significant conformational change between open and closed conformations of the NspS model. (c) Homology models of open and closed forms of the NspS protein with norspermidine responsiveness for single mutants mapped onto the structures. Residues identified in single-missense mutants are shown in all three panels and are coloured by location on the NspS protein model. Orange residues are found in the putative ligand-binding site, yellow residues are found internally and do not interact with norspermidine directly, and cyan residues are located on loops or exposed surfaces. Note: N68 (orange) is found in the ligand-binding site in the closed conformation but is on an exposed loop in the open conformation. Figures were created using Pymol and Microsoft PowerPoint.

