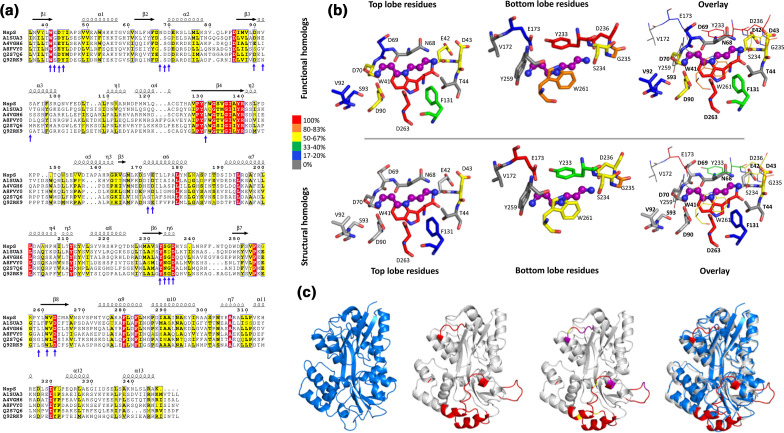
Fig. 9.
Comparison of NspS functional and structural homologues. (a) Multiple sequence alignment of NspS with previously identified functional homologues: HCH_06688 (UniProtID: Q2S7Q6) from Hahella chejuensis, Ssed_2394 (UniProtID: A8FVY0) from Shewanella sediminis, PST_0371 (UniProtID: A4VGH6) from Pseudomonas stutzeri, SMc00991 (UniProtID: Q92RK9) from Rhizobium meliloti, and Ping_1238 (UniProt ID: A1SUA3) from Psychromonas ingrahamii . Signal peptide sequences were removed and the alignment was generated by aligning homology models of all functional homologues and NspS with Promals3D. The figure was produced using ESPRIPT where red highlighted residues are completely conserved and yellow residues share some sequence similarity. (b) Comparison of putative ligand-binding residues across functional and structural homologues. The residues shown are from NspS around the docked norspermidine (purple ball and stick). When the protein adopts the closed conformation, the residues that encompass the ligand-binding site surround the ligand in a cylindrical shape. Therefore, the binding site was separated into two regions for clarity: those residues from the top and bottom lobes of the NspS homology model. The overlay views of the ligand-binding site have residues from the top lobe in thick sticks and bold residue numbers and residues from the bottom lobe in thin lines and unbold text. (c) Comparison of the E. coli PotD protein crystal structure (PDB ID: 1POT; blue; first ribbon diagram) with the NspS homology model (grey) ribbon diagrams. PotD is an ABC transporter periplasmic binding protein whereas NspS is a signal transduction periplasmic binding protein. Note, no crystal structure of periplasmic binding proteins involved in signal transduction (NspS functional homologues) have been determined. The regions of the NspS homology model that diverge compared to PotD and other structural homologues are coloured red (NspS residues 79–84, 145–163, 202–218, 240–248; second ribbon diagram); an overlay of the two proteins is shown in the fourth ribbon diagram. The third ribbon diagram has these regions of variability in red and also shows residues identified in this study via mutagenesis in purple for single mutants and yellow for double mutants.

