
Figure 7: HCP Data – Single Shell.
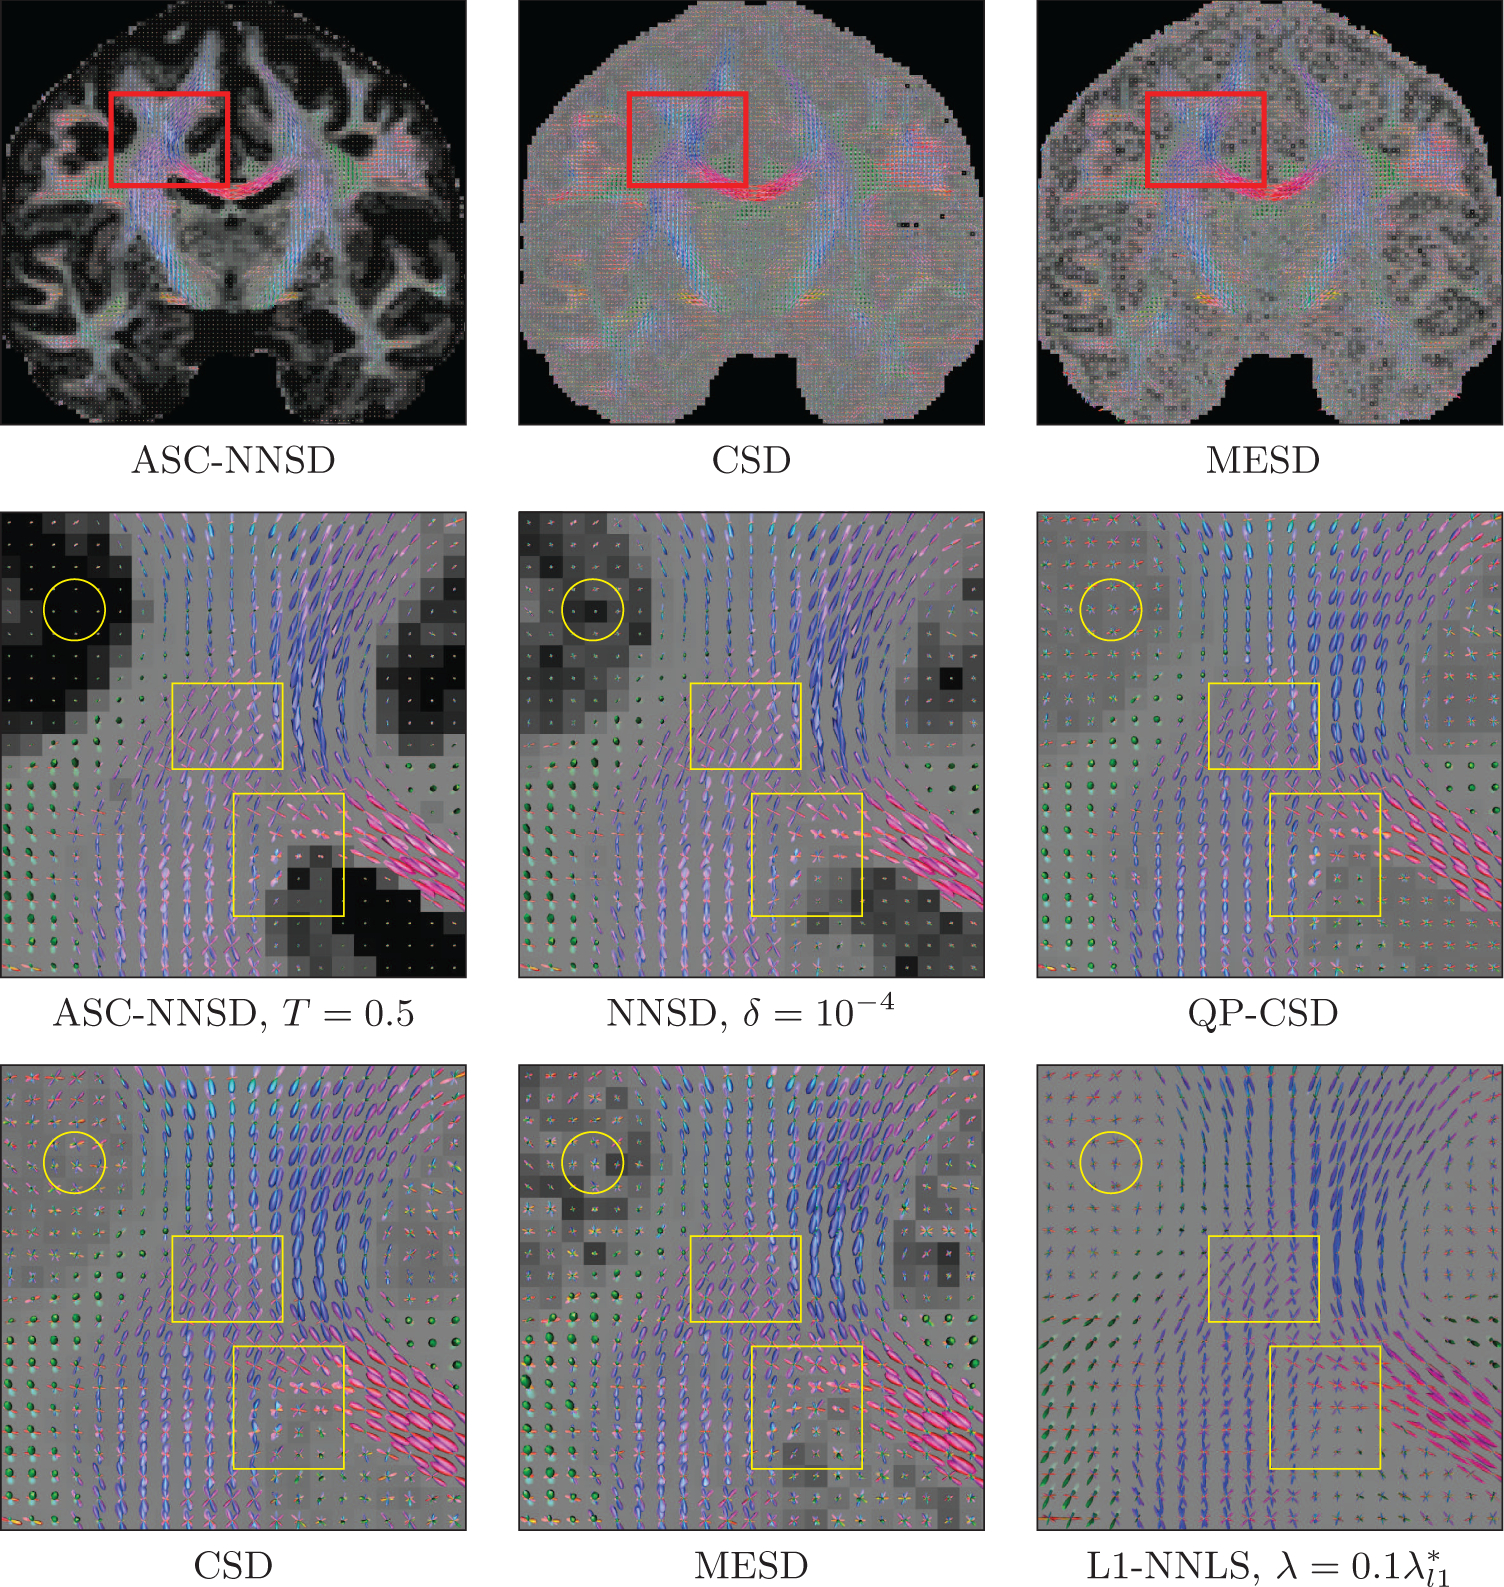
Coronal views and close-up views of the fODF fields generated by various methods from single shell data with b = 2000s/mm2. The background is the GFA map.
Official websites use .gov
A
.gov website belongs to an official
government organization in the United States.
Secure .gov websites use HTTPS
A lock (
) or https:// means you've safely
connected to the .gov website. Share sensitive
information only on official, secure websites.
Coronal views and close-up views of the fODF fields generated by various methods from single shell data with b = 2000s/mm2. The background is the GFA map.