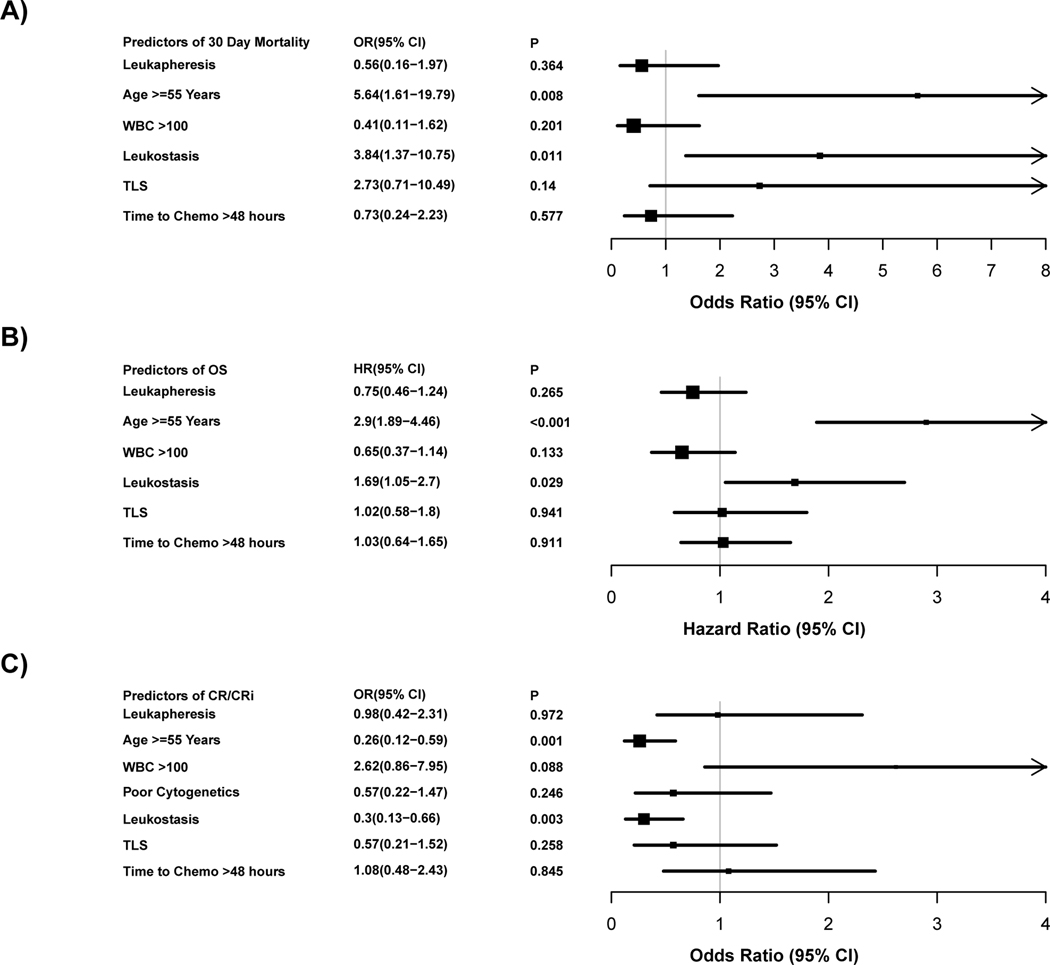
Figure 3: Forest plot of propensity score matched multivariate analysis.
The grey vertical line represents the odds ratio (Fig 3 A+C), and hazard ratio (Fig 3 B) of no effect. The box sizes are proportional to the precision of the estimates with large boxes indicating a great degree of precision. OR denotes odds ratio and HR denotes hazard ratio.
A: Predictors of 30-day mortality by multivariable logistic regression analysis (N=196).
B: Predictors of overall survival by using multivariable Cox regression analysis (N=196).
C: Predictors of CRc by multivariable logistic regression analysis (N=196).

