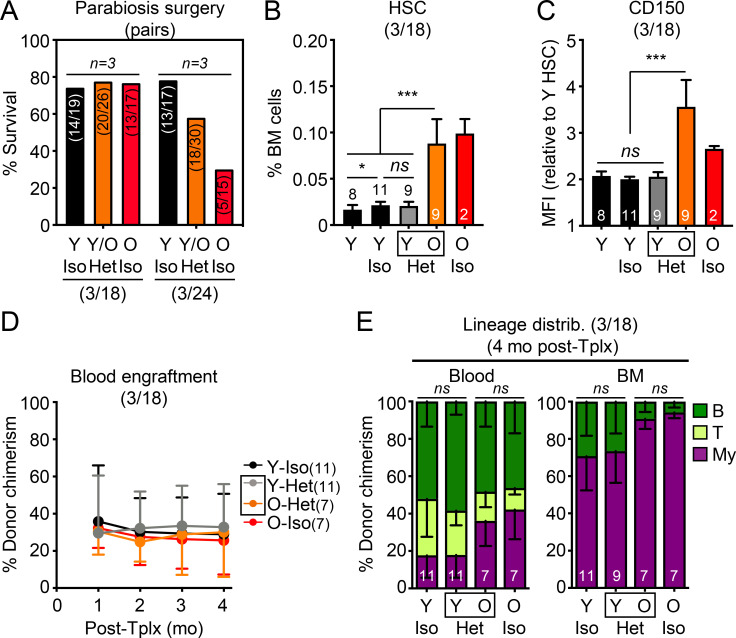
Figure S2.
Additional characterization of (3/24) and (3/18) parabiosis cohorts. (A) Postsurgery survival in the (3/18) and (3/24) parabiosis cohorts. Results represent the number of surviving pairs out of the total number of pairs established for each group in the three independent cohorts performed at each age range. (B–E) Analyses of young controls and (3/18) parabiosis pairs with (B) frequency, (C) CD150 level, (D) regenerative capacity (250 donor HSCs/recipient), and (E) lineage distribution at 4 mo after transplantation for the indicated HSC populations. MFI, mean fluorescence intensity. Data are means ± SD; *, P ≤ 0.05; **, P ≤ 0.01; ***, P ≤ 0.001.

