Figure S3.
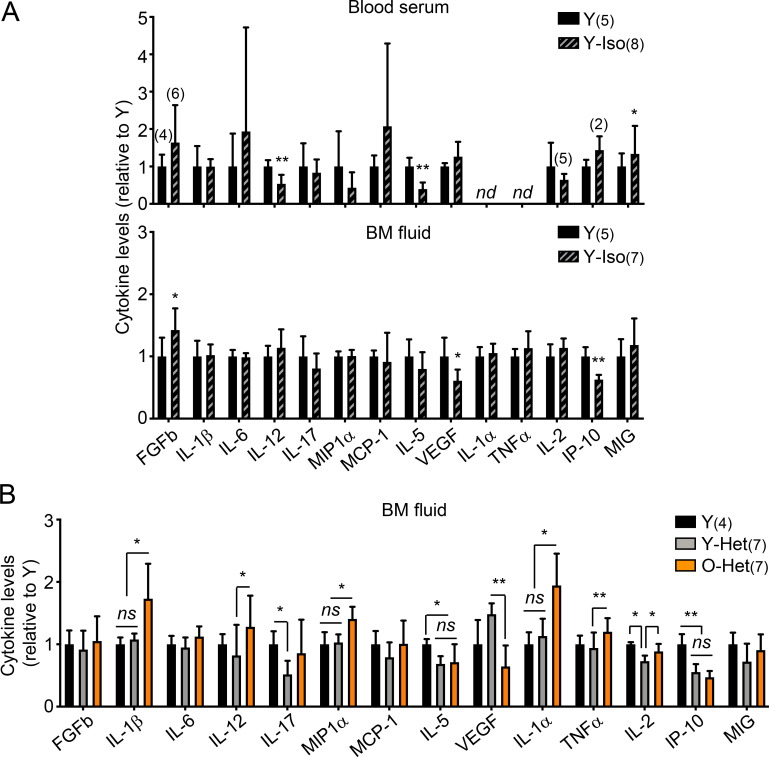
Inflammation in parabiosis cohorts. (A) Luminex-based cytokine analyses of serum and BM fluid from the indicated 3-mo-old young controls and Y/Y-Iso pairs from the (3/24) parabiosis cohorts. nd, not detected. (B) Luminex-based cytokine analyses of the BM fluid of the indicated 3-mo-old young controls and Y/O-Het pairs from an independent (6/23) parabiosis cohort. Data are means ± SD; *, P ≤ 0.05; **, P ≤ 0.01; ***, P ≤ 0.001.

