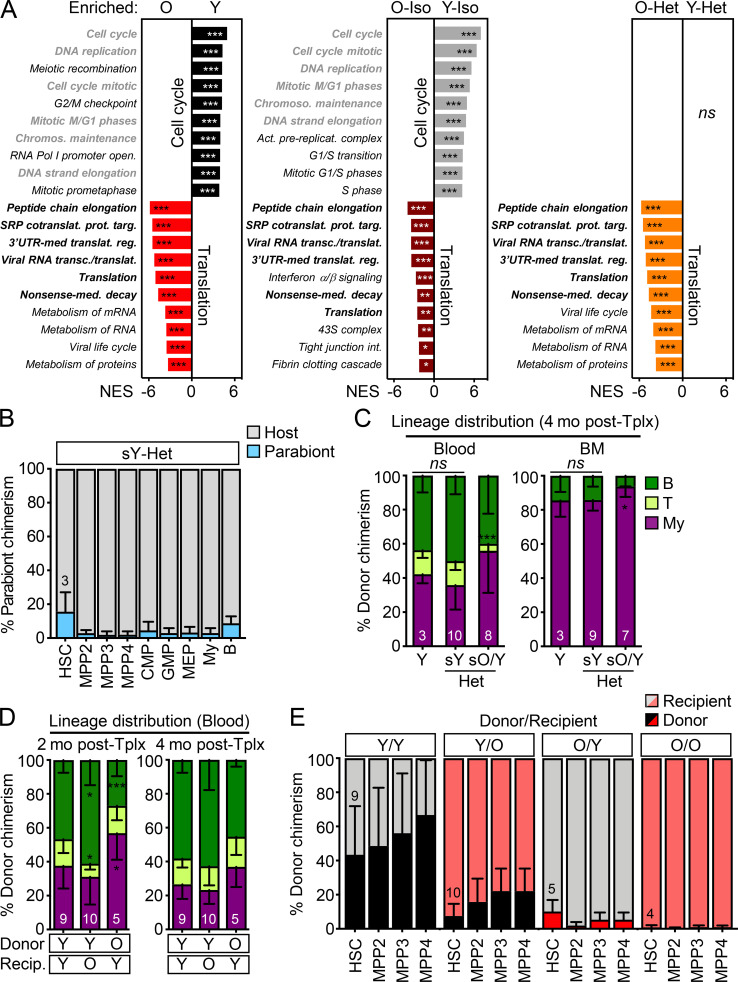
Figure S4.
Gene expression signatures of young and old HSCs and further characterization of transplanted mice. (A) RNA sequencing analyses of HSCs isolated from young and old controls and (3/24) pairs with gene-set enrichment analyses showing the top 10 differentially expressed pathways in the indicated comparisons. Gray indicates pathways enriched in Y HSCs and black in O HSCs, with bold highlighting common pathways. NES, normalized enrichment score with FDR–adjusted P values. (B) Percentage of old B6 BM cells in the indicated populations in young BJ Het parabionts 4.5 mo after separation. CMP, common myeloid progenitor; GMP, granulocyte/macrophage progenitor; MEP, megakaryocyte/erythrocyte progenitor. (C) Lineage distribution at 4 mo after transplantation in blood (left) and BM (right) for the parabiosis separation transplantation experiment shown in Fig. 8 E. (D) Lineage distribution in blood at 2 mo (left) and 4 mo (right) after transplantation for the heterochronic transplantation experiment shown in Fig. 8 G. O/O samples were excluded from this analysis due to failed engraftment. (E) Donor chimerism in HSC/MPP compartments after heterochronic transplantations. SRP, signal recognition particle; UTR, untranslated region. Data are means ± SD; *, P ≤ 0.05; **, P ≤ 0.01; ***, P ≤ 0.001.

