Figure 4.
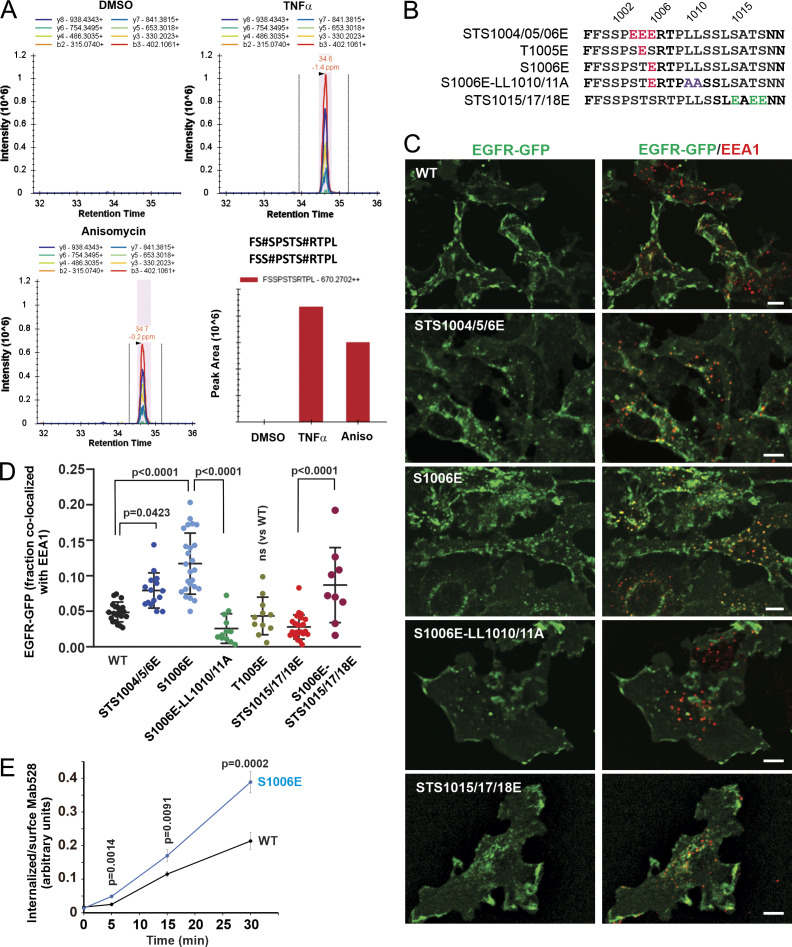
Mass spectrometry and phosphomimetic mutations demonstrate the importance of serine 1006 phosphorylation for p38-induced EGFR endocytosis. (A) HeLa/FAP-EGFR cells were untreated or treated with 10 ng/ml TNFα or 100 nM anisomycin (Aniso) for 15 min, and lysed. EGFR was immunoprecipitated, and immunoprecipitates were resolved by SDS-PAGE. Mass spectrometry analysis of corresponding gel bands was performed. Peaks corresponding to the peptides containing phosphoS1006 are shown. These peptides were also phosphorylated at S1001 or S1002. See Table S1. (B) Main phosphomimetic mutations with mutant names indicated. (C) PAE cells stably expressing EGFR-GFP (WT or mutants as indicated) were immunostained with the EEA1 antibody. 3D images were acquired through the 488-nm (green, EGFR-GFP) and 640-nm (red, EEA1) channels. Maximum intensity projections of three consecutive confocal sections are shown. Scale bars, 10 µm. (D) Quantification of the fraction of EGFR-GFP (WT and mutants as indicated) colocalized with EEA1 endosomes in images exemplified in C and Fig. S4. Scatter dot plot represents mean values with SDs (n = 8–21). P values were determined by multiple-comparison one-way ANOVA. (E) The antibody-uptake endocytosis assay was performed in PAE cells expressing WT or the S1006E EGFR-GFP mutant. The cells were preincubated with the EGFR antibody Mab528 for 10 min at RT, and then incubated at 37°C for indicated times. Cell-surface and internalized Mab528 was labeled with secondary antibodies conjugated with, respectively, Cy5 and Cy3, as described in Materials and methods. 3D images were acquired through 640-nm (surface Mab528) and 561-nm (internalized Mab528) channels. The ratio of internalized/surface EGFR (Cy3/Cy5) was calculated, and mean values with SEM (n = 13–16) were plotted against time. P values were determined by the unpaired Student’s t test.

