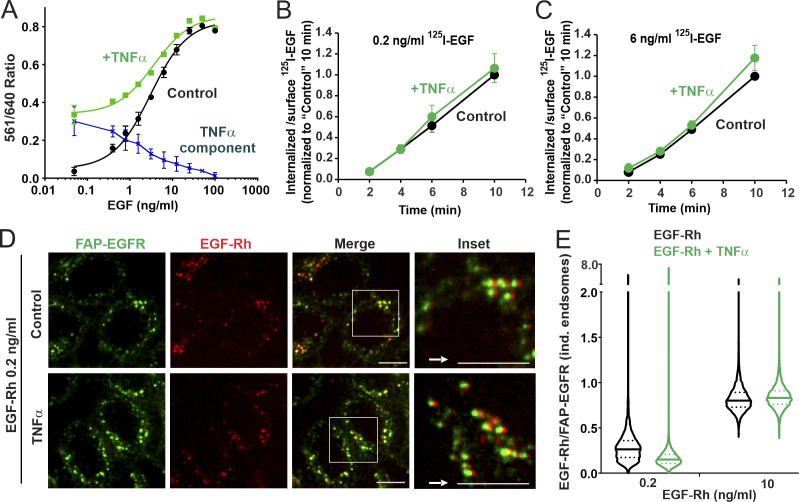
Figure 6.
Simultaneous cell stimulation with EGF and TNFα enhances ligand-free EGFR internalization only at low concentrations of EGF and targets ligand-bound and free EGFRs to the same endosomes. (A) HeLa/FAP-EGFR cells were treated with 0.48–100 ng/ml EGF in the absence (black) or presence (green) of 3 ng/ml TNFα for 15 min, and the FERI internalization assay was performed. Mean values of the 561/640 ratio with SEM of duplicates are plotted against log of EGF concentration. Values obtained in the absence of TNFα were subtracted from those in the presence of TNFα to estimate the contribution of TNFα-induced internalization of FAP-EGFR (dotted blue). This experiment is representative of several independent experiments. (B and C) HeLa/FAP-EGFR cells were incubated with 0.2 ng/ml (B) or 6 ng/ml (C) of 125I-EGF in the absence or presence of 3 ng/ml TNFα for 10 min at 37°C. Surface-bound and internalized 125I-EGF were measured, and the ratio of internalized and surface 125I-EGF is plotted against time. The data were normalized to the value of the internalized/surface 125I-EGF ratio at the 10-min point in the absence of TNFα. Mean values with SDs from three independent experiments are presented. Differences between internalization rates in control and TNFα-stimulated cells are not statistically significant. (D and E) HeLa/FAP-EGFR cells were labeled with MG-B-Tau and treated with 0.2 ng/ml or 10 ng/ml EGF-Rh for 15 min in the absence or presence of 3 ng/ml TNFα. After fixation, 3D images were acquired through 640-nm (green, FAP-EGFR) and 561-nm (red, EGF-Rh) channels. In D, single confocal sections of cells treated with 0.2 ng/ml EGF-Rh are shown. Insets are higher magnification images of regions marked by white rectangles in which the 561-nm channel image (red, EGF-Rh) was shifted by 3 pixels as indicated by the white arrow for better visualization of EGF-Rh and FAP-EGFR colocalization in individual (ind.) endosomes. Scale bars, 10 µm. In E, the ratio of EGF-Rh and MG-B-Tau fluorescence (EGF-Rh/FAP-EGFR) in individual endosomes calculated in images generated as in D. Median and quartiles are shown on the violin graph; n > 5,000 endosomes.

