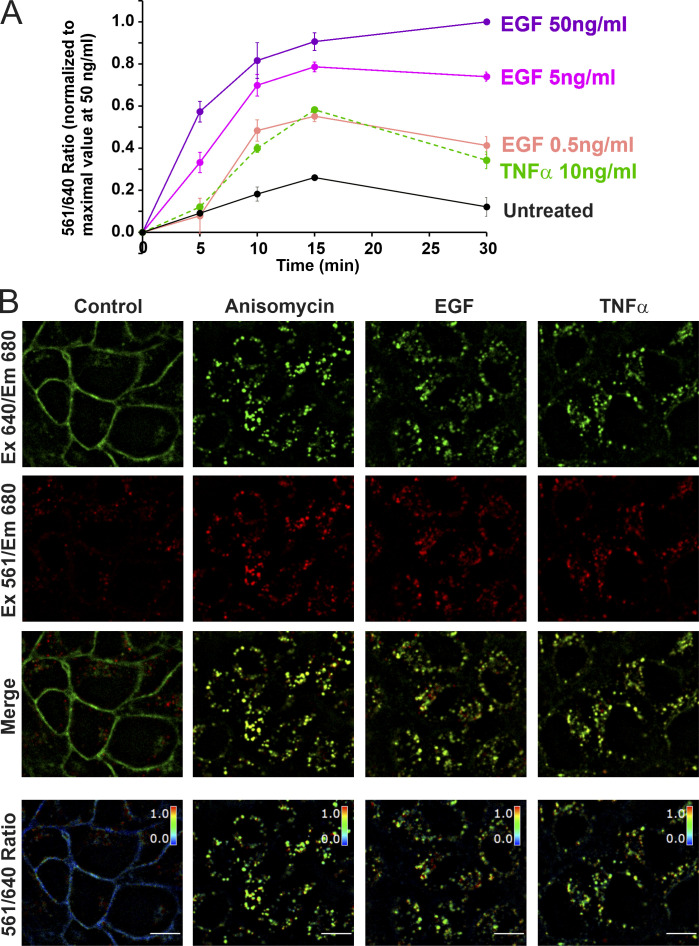
Figure S1.
EGF and TNFα stimulated endocytosis of FAP-EGFR demonstrated using FERI assay and single-cell imaging. (A) Time course of FAP-EGFR internalization. HeLa/FAP-EGFR cells were labeled with MG-Bis-SA and further incubated in starvation medium (Untreated) or stimulated with either EGF (0.5, 5, or 50 ng/ml) or TNFα (10 ng/ml) for indicated times. The 561/640 ratio was measured using the FERI internalization assay. In each experiment, the background ratio at time “zero” was determined by y-intersection of the linear regression slope calculated using ratio values in untreated cells incubated for 5 and 10 min. This ratio value was subtracted from raw ratio values in each experiment, and the resulting background-subtracted ratio values were normalized to the ratio in cells stimulated with 50 ng/ml EGF for 30 min in each time-course experiment. The data in the graph represent mean values with SEMs (n = 3 independent experiments). SEMs are not shown if they are smaller than markers. (B) Examples of single-cell FAP-EGFR ratiometric imaging. Cells labeled with MG-Bis-SA were either untreated or treated with 100 nM anisomycin, 4 ng/ml EGF, or 3 ng/ml TNFα for 15 min at 37°C. 3D stacks of x-y confocal images were acquired from living cells through the 640-nm channel (Ex 640/Em 680; pH-independent) and the FRET channel (Ex 561/Em 680, pH-sensitive). Individual confocal sections through the middle of cells are presented. The 561/640 ratio is presented as pseudocolored image modulated to the intensity of the 640-nm channel. Scale bar, 10 µm. Em, emission; Ex, excitation.

