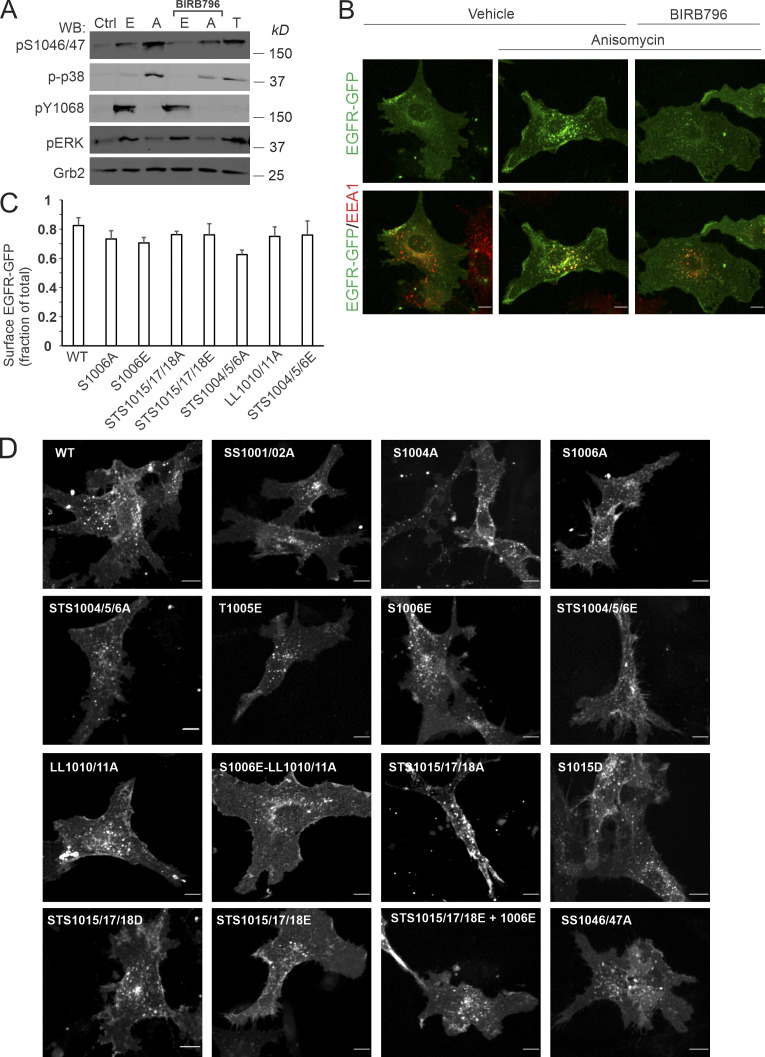
Figure S3.
PAE cells as a cell model for studying p38-dependent endocytosis of EGFR-GFP and its mutants: activation of p38, steady-state EGFR-GFP subcellular distribution, and p38-dependent and EGF-stimulated EGFR-GFP endocytosis. (A) PAE cells stably expressing EGFR-GFP were incubated with 10 ng/ml EGF (E), 20 ng/ml TNFα (T), or 100 nM anisomycin (A) for 15 min at 37°C after preincubation with DMSO (vehicle) or BIRB976 for 90 min. Cells were lysed, and lysates were probed by Western blotting (WB) with antibodies to p1046/47, active p38 (p-p38), pY1068, pERK1/2, and Grb2 (loading control). (B) PAE cells stably expressing EGFR-GFP were incubated with 100 nM anisomycin for 15 min at 37°C after preincubation with DMSO (vehicle) or BIRB976 for 90 min. Cells were immunolabeled with the EEA1 antibody to mark early endosomes. 3D images were acquired through the 488-nm (green, EGFR-GFP) and 640-nm (red, EEA1) channels. Maximum intensity projections are shown. Scale bars, 10 µm. (C) PAE cells stably expressing either WT or indicated EGFR-GFP mutants were fixed and immunolabeled with EGFR antibody Mab528 to label cell-surface EGFR-GFP followed by secondary antibodies conjugated to Cy5. 3D images were acquired through 488-nm (GFP, total EGFR-GFP) and 640-nm (Cy5, surface EGFR-GFP) channels. The ratio of Cy5 to GFP fluorescence intensities corresponds to the fraction of cell-surface EGFR-GFP. Bar graph represents mean values with SDs (n = 10–14). (D) PAE cells expressing either WT or indicated EGFR-GFP mutants were stimulated with 1 ng/ml EGF-Rh for 15 min at 37°C. Cells were 3D-imaged through the 488-nm channel (GFP) and the 561-nm channel (EGF-Rh, not shown). Maximum intensity projection images are presented. Scale bars, 10 µm. Ctrl, control.

