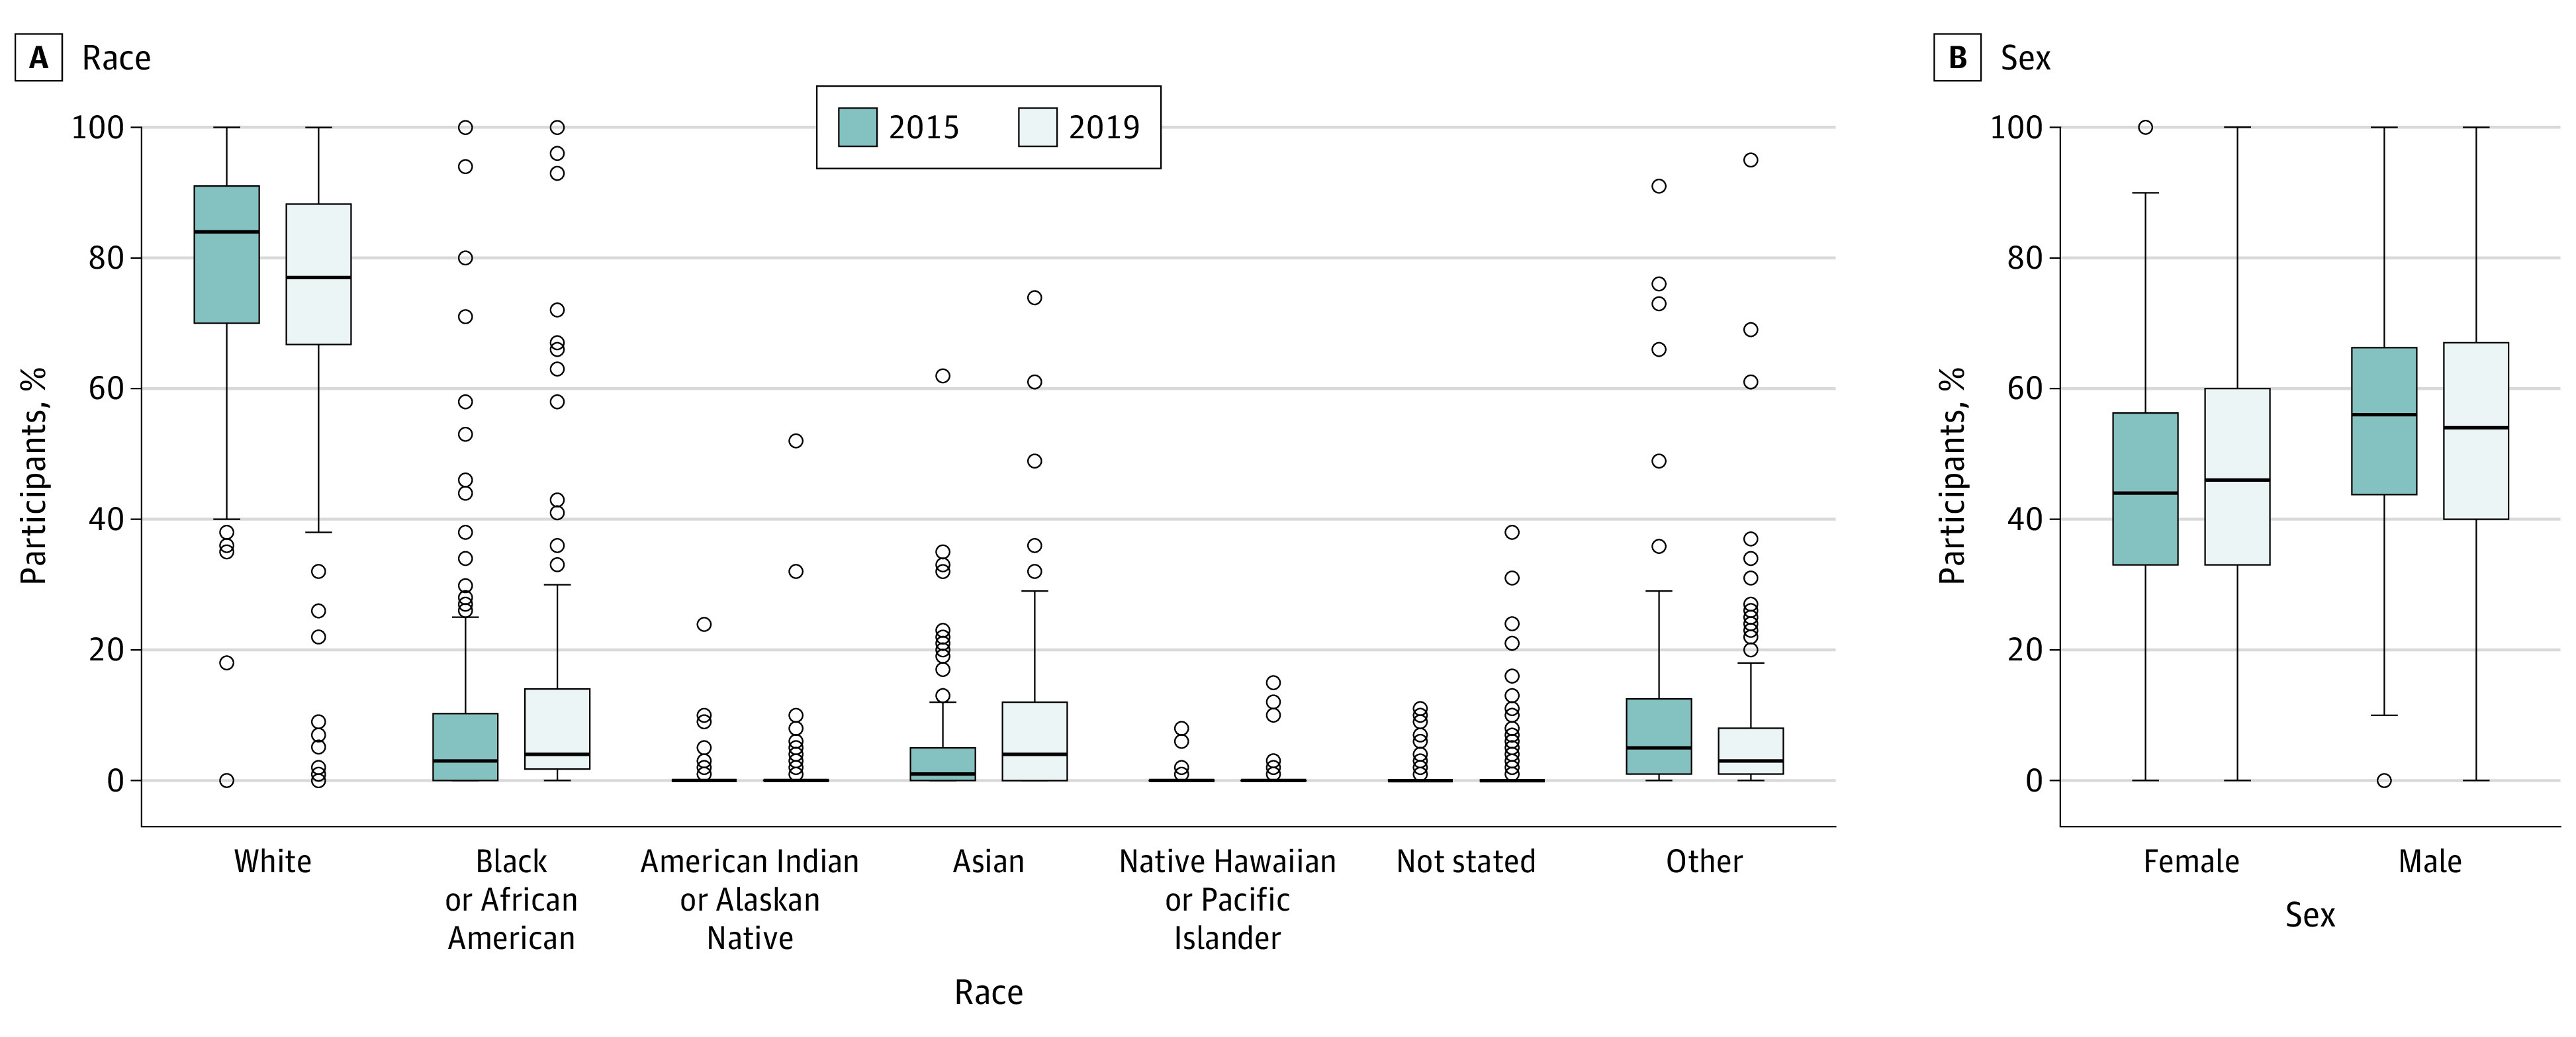
Figure. Race and Sex Representation in Studies Published in 2015 and 2019.

Middle horizontal lines represent medians; boxes, the interquartile range; and error bars, 1.5 times the interquartile ranges beyond the 25th and 75th percentiles. Outliers are represented by dots.
