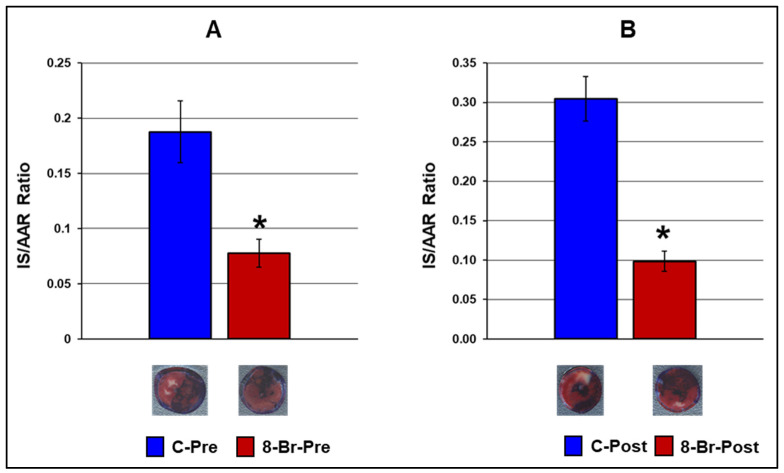
Figure 7.
Infarct size in hearts of the first and second series of experiments. (A) First series of experiments. The hearts were treated with 8 Br prior to regional ischaemia (8-Br-Pre group) or no treatment with 8-Br (C-Pre group). (B) Second series of experiments. The hearts were treated with 8-Br at the end of regional ischaemia (8-Br-Post group) or received no treatment (C-Pre group). The data are presented as the mean ± SEM. * p < 0.05 vs. 8-Br-Pre or 8-Br-Post group, respectively. Representative images of the stained heart slices of each group are shown under the corresponding bars. The red area, not stained with Evance blue, is the area at risk. The dark-blue area is non-ischaemic myocardium, and the white, pale zone inside the area at risk is the infarcted (necrotic) area.

