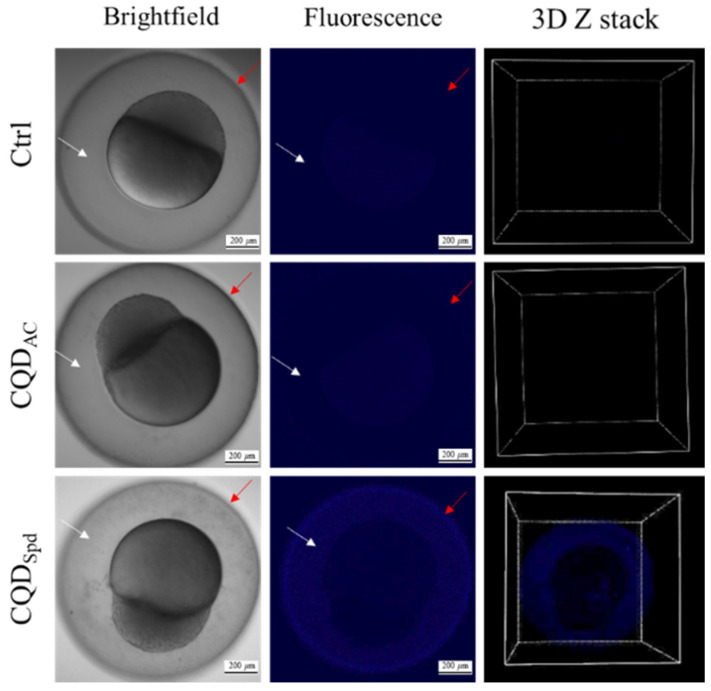
Figure 2.
Brightfield, fluorescence, and 3D Z stack images of zebrafish embryos after soaking for 3 h in 100 ppm of CQDAC or CQDSpd solutions. 0.5-hpf zebrafish embryos were exposed to 100 ppm CDQs for 3 h. The distribution of the different surface charged CQDs in embryos was observed by confocal fluorescence microscopy. The white arrow indicates the perivitelline space; the red arrow represents the relative position of chorion. Scale bar = 200 μm.

