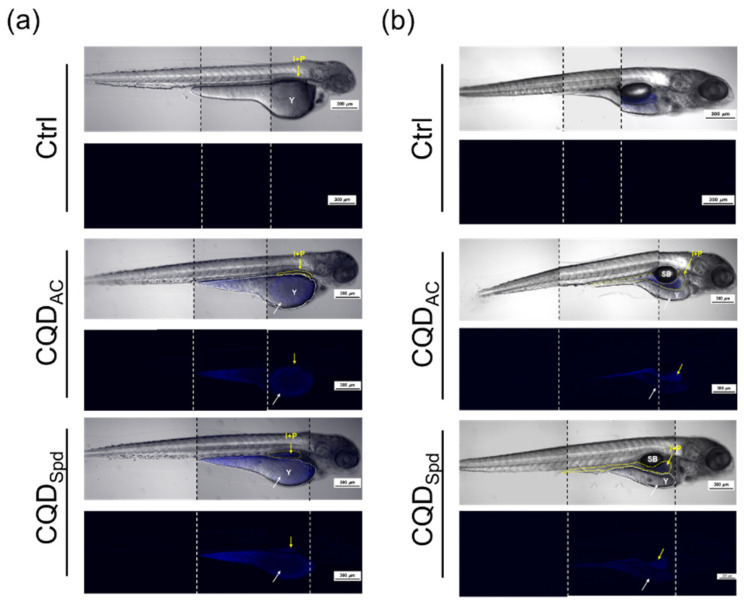
Figure 5.
Distribution and bioaccumulation of CQDAC and CQDSpd. Bright field and fluorescence images of zebrafish eleutheroembryo (a) after 24 h exposure of CQDs and (b) 72 h after return to normal conditions. The yellow arrow indicates the area containing the intestines (I) and the pancreas (P); the white arrow represents the location of the yolk sac (Y). Scale bar = 300 μm.

