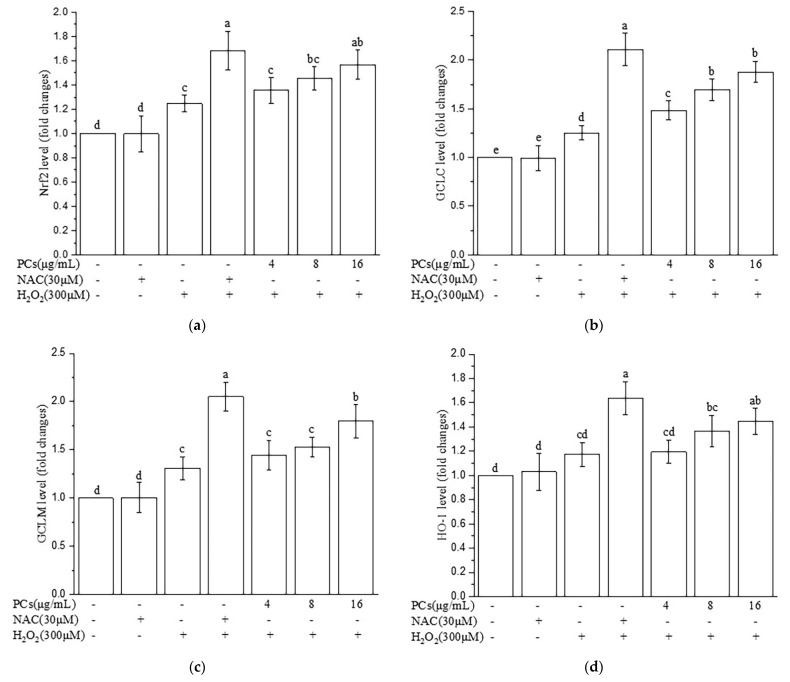
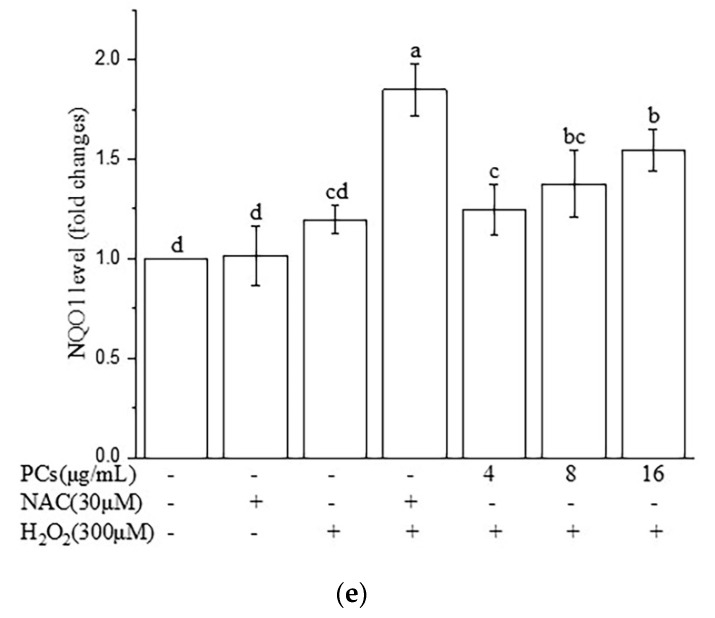
Figure 7.
Effects of PCs on the Nrf2/ARE pathway in H2O2-treated zebrafish larvae. (a) Nrf2 levels; (b) GCLC levels; (c) GCLM levels; (d) HO-1 levels; (e) NQO1 levels. Data are expressed as the mean ± SD. Values with different letters above are significantly different (p < 0.05, one-way ANOVA test).


