
Figure 3.
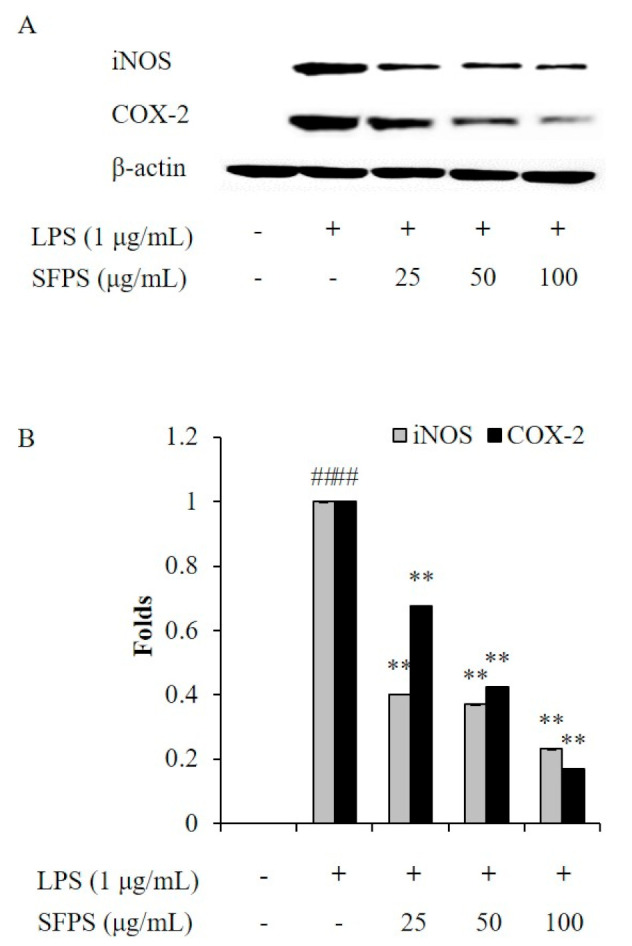
Effect of SFPS on the expression levels of iNOS and COX-2 in LPS-stimulated RAW 264.7 cells. (A) Inhibitory effect of SFPS on iNOS and COX-2 expression, and (B) relative amounts of iNOS and COX-2. RAW 264.7 cells were treated with different concentrations of SFPS (25, 50, and 100 μg/mL) and stimulated with LPS (1 μg/mL) for 24 h. The levels of iNOS and COX-2 were analyzed by western blot assay. The relative amounts of iNOS and COX-2 were compared with β-actin. The experiments were conducted in triplicate and data are expressed as mean ± SE. ** p < 0.01 as compared to LPS-treated group and ## p < 0.01 as compared to control group.