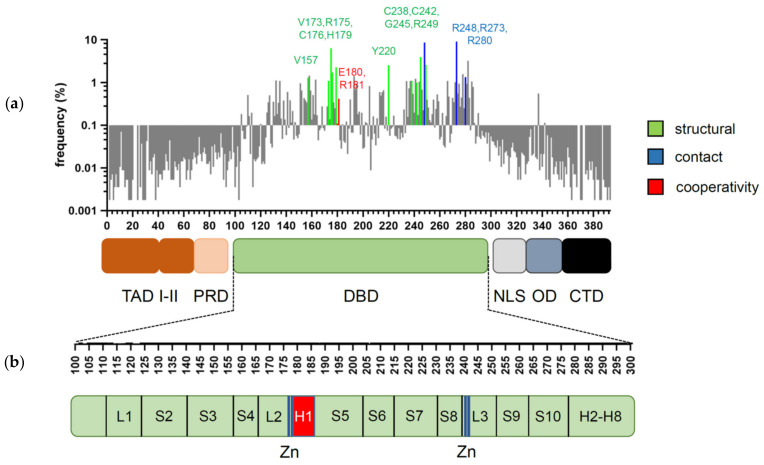
Figure 1.
Domain structure of p53 and distribution of cancer-associated mutations. (a) Frequency and distribution of TP53 mutations detected in somatic tumors. Highlighted are the codons most frequently affected by structural (green), contact (blue), and cooperativity (red) mutations (references in text). (b) Secondary structure of p53 DBD. Residues responsible for zinc (Zn) ion coordination (blue) and H1 helix (red) are highlighted.

