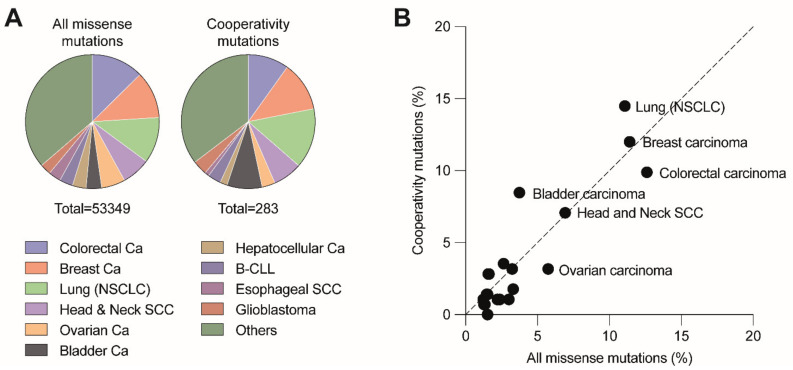
Figure 3.
Distribution of cooperativity mutations across different cancer types. (A) Pie charts depict the distribution of all missense and cooperativity mutations across the listed cancer types. (B) Cancer type distribution of cooperativity mutations correlates with the distribution of all missense mutations (R2 = 0.8779, p < 0.001). Analysis based on all tumor samples with p53 missense mutations listed in the UMD TP53 Mutation Database (https://p53.fr/tp53-database, Release 2017_R2, accessed on 12 May 2021).

