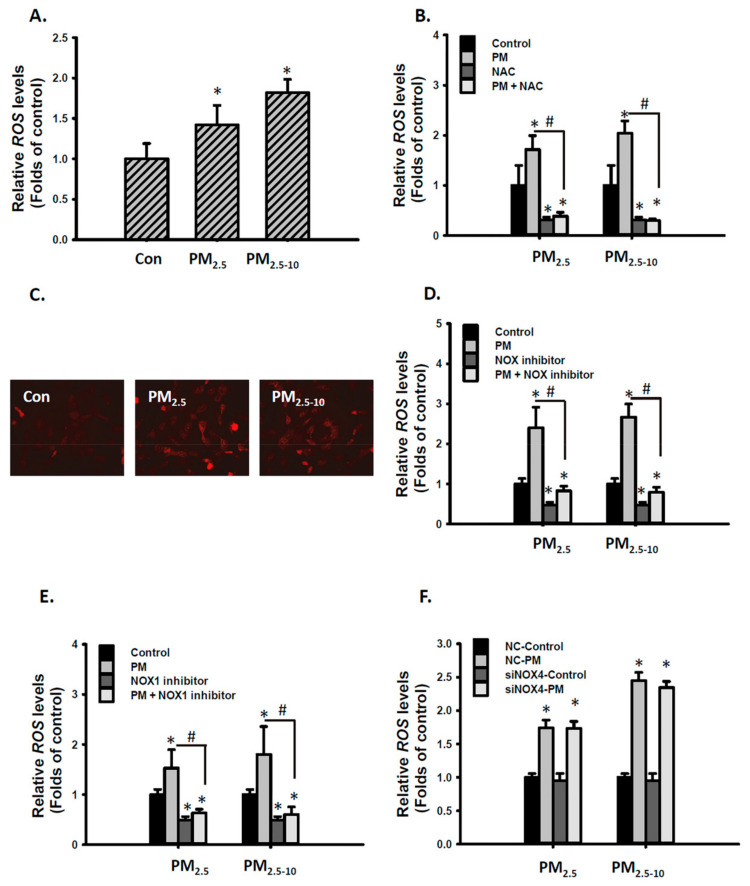
Figure 3.
PM2.5 and PM2.5-10 increased ROS levels through the NOX1 dependent pathway in MVSMCs. (A) MVSMCs were treated with d2H2O or 12.5 μg/mL PM2.5 or PM2.5-10 for 2.5 h. (B) MVSMCs were treated with d2H2O or 12.5 μg/mL PM2.5 or PM2.5-10 with and without 10 μM NAC for 2.5 h. (C) MVSMCs were treated with d2H2O or 12.5 μg/mL PM2.5 or PM2.5-10 for 24 h, and mitochondrial ROS were detected with MitoSOX. (D) MVSMCs were treated with d2H2O or 12.5 μg/mL PM2.5 or PM2.5-10 with and without 10 μM of NOX inhibitor for 2.5 h. (E) MVSMCs were treated with d2H2O or 12.5 μg/mL PM2.5 or PM2.5-10 with and without 10 μM of NOX1 inhibitor for 2.5 h. (F) NC-MVSMCs and siNOX4-MVSMCs were treated with d2H2O or 12.5 μg/mL PM2.5 or PM2.5-10 for 2.5 h. Intracellular ROS levels were quantified using the cellular H2DCFDA assay. The results are presented as the mean ± SD for three or four independent experiments. * p < 0.05, compared with vehicle-treated cells. # p < 0.05, compared with inhibitor-treated cells. Con: d2H2O treatment as control; NC: negative control for siRNA.

