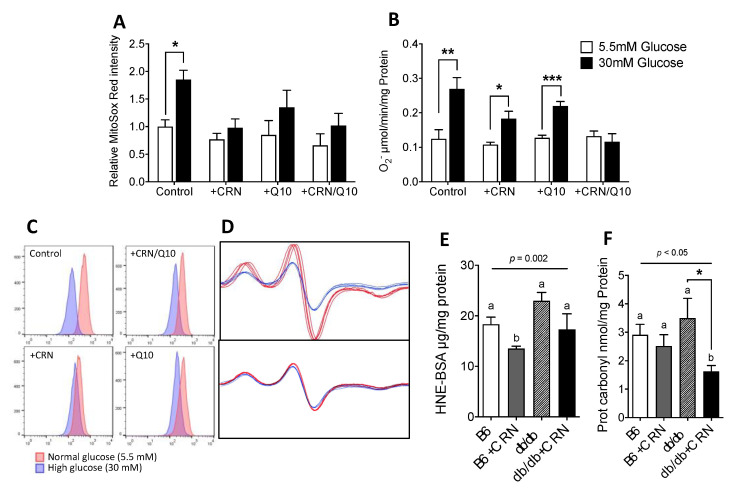
Figure 2.
FACS results, expressed as median PE-Texas Red emission at ex488nm in HepG2 cells labeled with MitoSox Red. Cells were either treated with sham, 10 mM CRN, 10 µM CoQ or a combination of CRN and CoQ at 10 mM and 10 µM, respectively. Results are presented as values relative to control (A). Representative FACS histograms of MitoSox Red labeled HepG2 cells as presented (C). Superoxide production in HepG2 cells measured using CMH spin trapping in EPR spectroscopy (B). FACS and EPR experiments are compiled results from 4 separate experiments. Results from EPR were normalized to total protein content. EPR spectra for cells treated with sham and a 10 mM CRN/10 µM CoQ combination shown (D). 4-Hydroxynonenal content in mouse liver lysates measured by 4-HNE adduct competitive ELISA (E) for treated and untreated control (C57B) and db/db mice. Protein Carbonyl ELISA results from the same animals (F). ELISA results were normalized by total protein content. n = 5 for all groups. All values are represented as mean ± SEM. Statistical analysis was performed using Student’s t-test (A,B) and one-way ANOVA with multiple comparison differences denoted (E,F). (a,b) Different letters indicate significant differences in mean values from repeated-measures ANOVA (p < 0.05). A p-value of <0.05 was considered significant. *, ** and *** denotes a significance of p < 0.05, p < 0.01 and p < 0.001, respectively in all cases.

