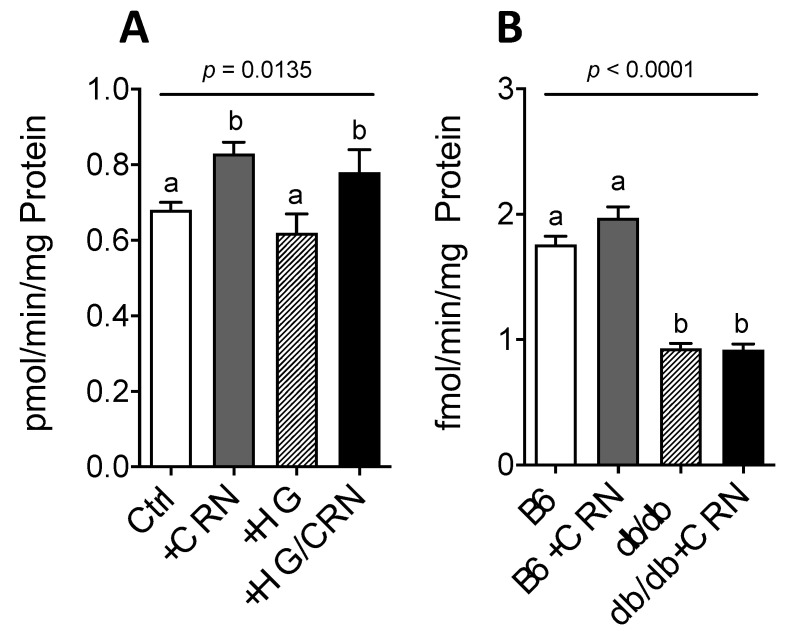
Figure 5.
β-oxidation rate in HepG2 cells grown in normal (5.5 mM) and high (30 mM) glucose with and without treatment with 10 mM CRN, 10 µM CoQ or a combination of the two (A). β-oxidation rate in control (C57B) and db/db mice liver treated with CRN, CoQ or CRN+CoQ compared to non-treated controls (B). The results represent mean values of five different experiments performed in triplicate. Values are represented as mean ± SEM in each group. Statistical analysis was performed using one-way ANOVA with multiple comparison differences denoted. (a,b) Different letters indicate significant differences in mean values from repeated-measures ANOVA (p < 0.05). A p-value of <0.05 was considered significant.

