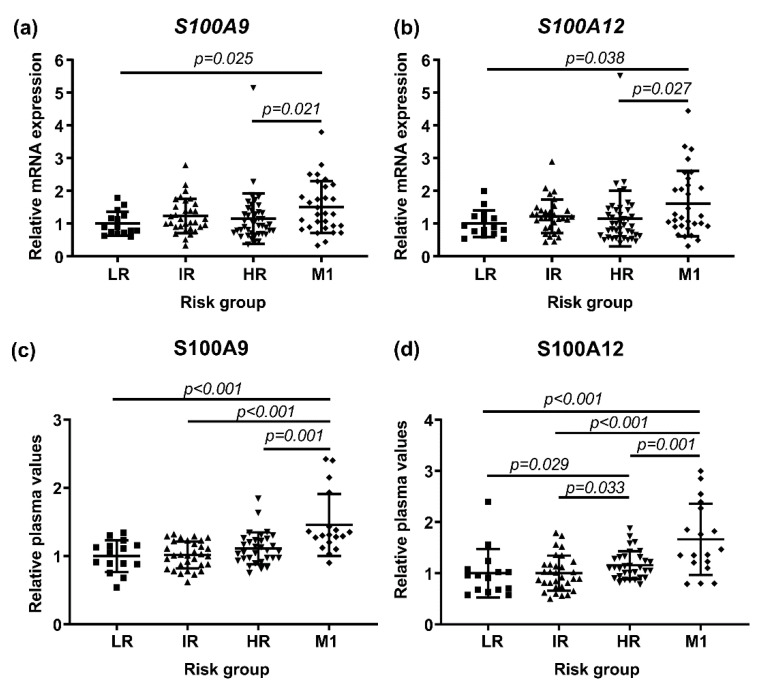
Figure 1.
Evaluation of S100A9 and S100A12 according to patient risk group at diagnosis, stratified as low risk (LR), intermediate risk (IR), high risk (HR) and metastasis (M1). Shown are the relative mRNA levels of S100A9 (a) and S100A12 (b) in PBMCs; LR (n = 15), IR (n = 32), HR (n = 42), M1 (n = 30) and relative plasma protein levels of S100A9 (c) and S100A12 (d); LR (n = 15), IR (n = 31), HR (n = 32) and M1 (n = 18). Each dot represents one individual and horizontal bars indicate mean values with standard deviation. Group comparisons were performed using Kruskal–Wallis followed by the Mann–Whitney U test. Significant p-values from the Mann–Whitney U tests are indicated.

