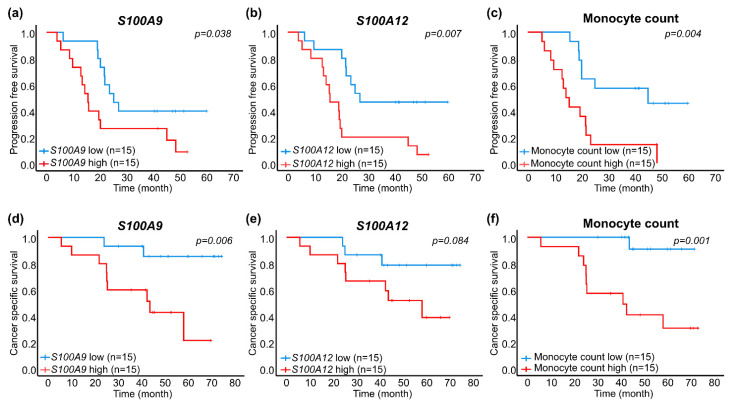
Figure 2.
Kaplan–Meier survival analysis of patients in the metastatic group based on low (blue line) and high (red line) S100A mRNA expression and monocyte count, grouped by median values as cut off. Shown is PSA progression-free survival for S100A9 (a), S100A12 (b) and monocyte count (c), and prostate cancer-specific survival for S100A9 (d), S100A12 (e) and monocyte count (f).

