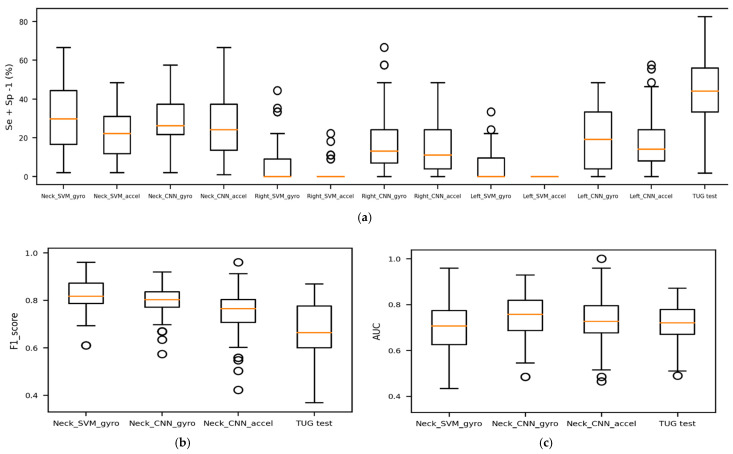
Figure 4.
Comparison of models’ prediction performance. (a) Represents the models’ trade-off between sensitivity and specificity; (b) compares the best models’ F1-score with the traditional TUG; (c) illustrates the overall power of faller/non-faller discrimination for the best models and the traditional TUG.

