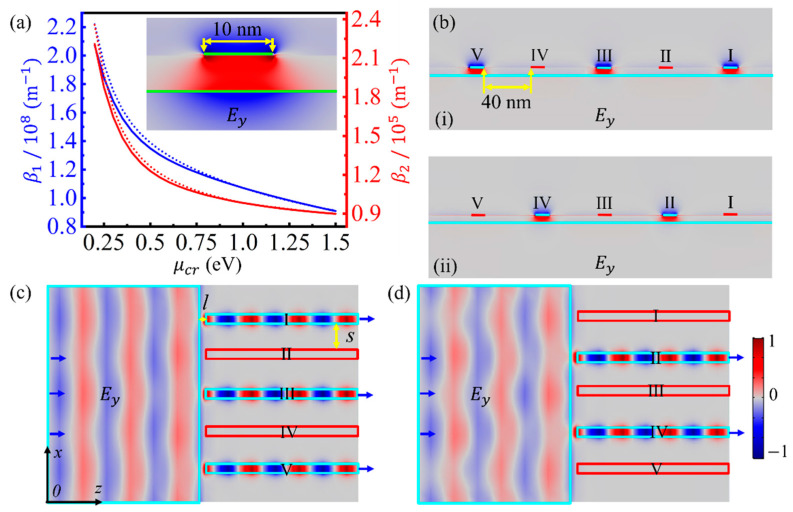
Figure 4.
(a) Dependences of the real and imaginary parts of β on the chemical potential of the GNR. The inset in (a) shows the distribution of Ey. (b) Distributions of Ey on the output plane of a multichannel optical switch, parts (i) and (ii) corresponding to (c) and (d), respectively. (c,d) Distributions of Ey on the center plane of the dielectric spacer for GNRs with different chemical potentials. The interior areas of the cyan and red boxes (or lines) represent graphene with chemical potentials of 1.0 and 0.3 eV, respectively. All electric field distributions share the same color legend.

