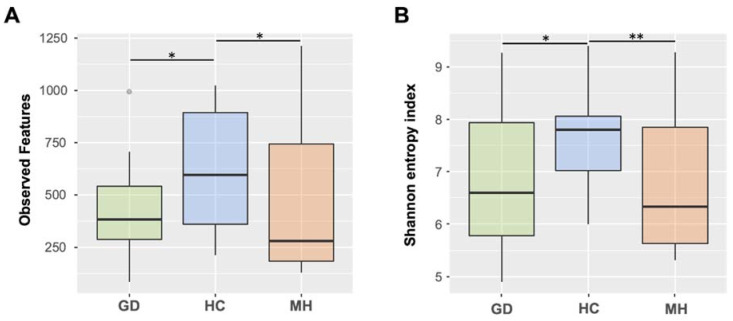
Figure 1.
Boxplots representing median and interquartile ranges of alpha diversity estimated measuring the observed features (A) or Shannon’s index (B) in nasal microbiota from piglets at weaning from healthy control farms (HC) and farms with polyserositis in the nursery caused by Mycoplasma hyorhinis (MH) or caused by Glaesserella parasuis (Glässer’s disease, GD). Outlier is indicated with a grey circle on the plot. Error bars are standard deviation. * means p < 0.05; ** means p ≤ 0.01.

