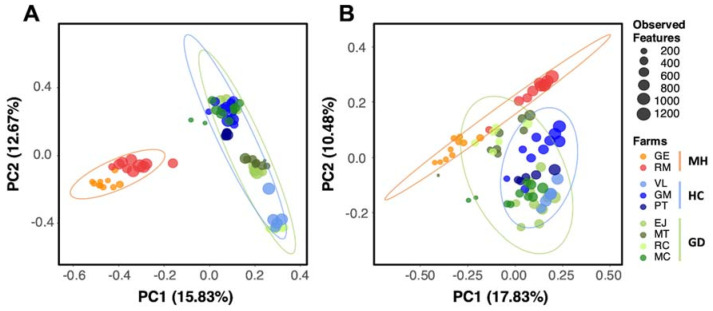
Figure 2.
Beta diversity analysis on Bray Curtis (A) and unweighted Unifrac distances (B) of the nasal microbiota of weaning piglets. Each circle represents the microbial composition of each sample and the size of the circles is proportional to the number of Observed Features as indicated in the legend. Healthy control farms (HC) are depicted in blue, while farms with polyserositis caused by M. hyorhinis (MH) are in orange and G. parasuis (GD) in green palettes. Ellipses are calculated with the Euclidean distances of the grouped samples.

