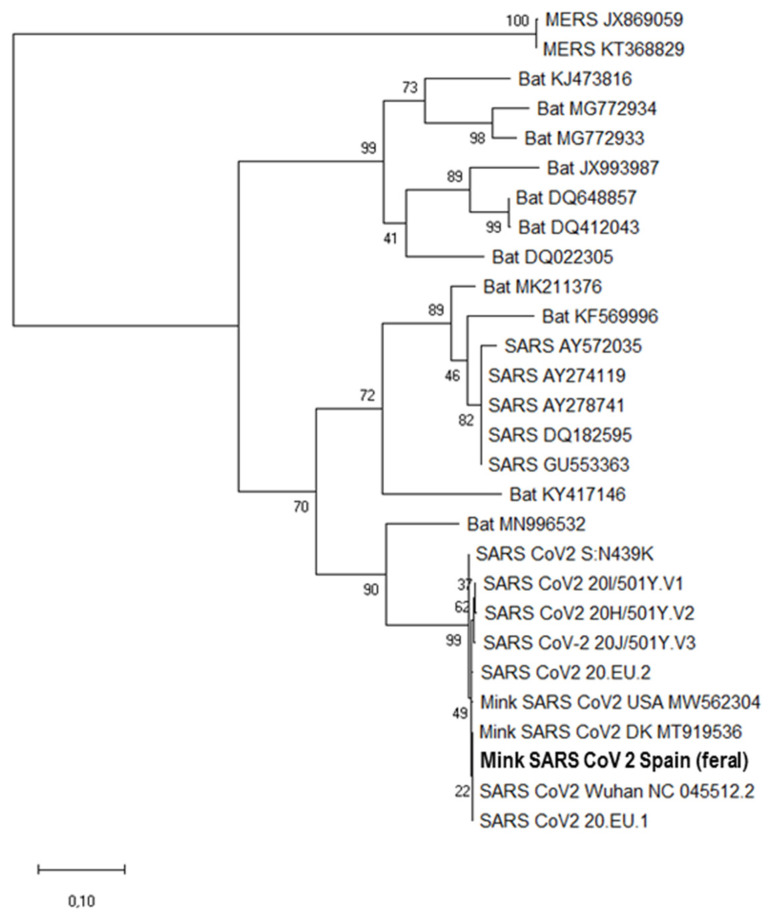
Figure 3.
Molecular phylogenetic analysis using the sequence of a 397-nucleotide fragment of the SARS CoV-2 S gene (consensus genome coordinates, nt 22,728–23,124). The evolutionary history was inferred by the maximum likelihood method based on the Tamura–Nei model. The tree with the highest log likelihood (−2888) is shown. The percentage of trees in which the associated taxa clustered together is shown next to branches. Initial tree(s) for the heuristic search were obtained automatically by applying the Neighbor-Join and BioNJ algorithms to a matrix of pairwise distances estimated using the Maximum Composite Likelihood (MCL) approach, and then selecting the topology with superior log likelihood value. The tree is drawn to scale, with branch lengths according to (see scale bar at the bottom) the number of substitutions per site. The analysis involved 28 nucleotide sequences. The sequence obtained from two feral American mink reported here is highlighted in bold.

