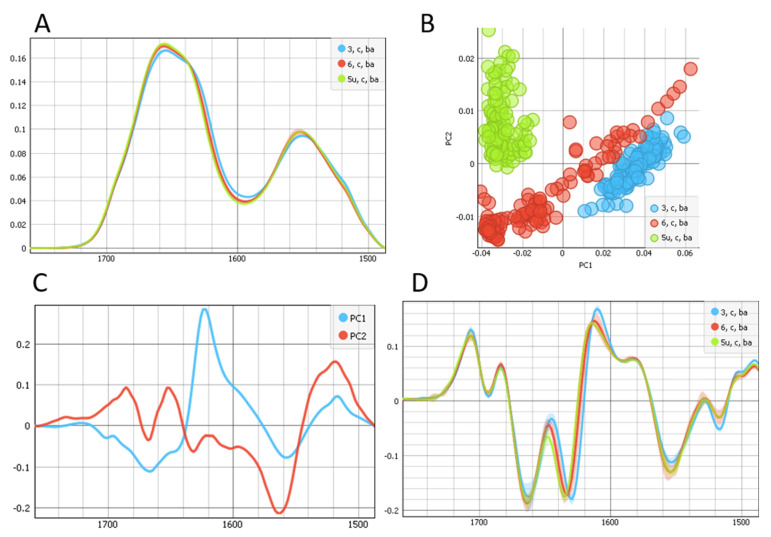
Figure 1.
(A) Average spectra of the protein and ester regions (1485 until 1760 cm−1) of UV-irradiated (green) non-cataractous LC and the two non-irradiated (red and blue) non-cataractous LCs. (B) The PCA scores plot denotes the variability associated with the first two components. (C) First and second PCA components, PC1 and PC2 score plot. (D) The second derivative of average spectra of the protein and ester regions.

