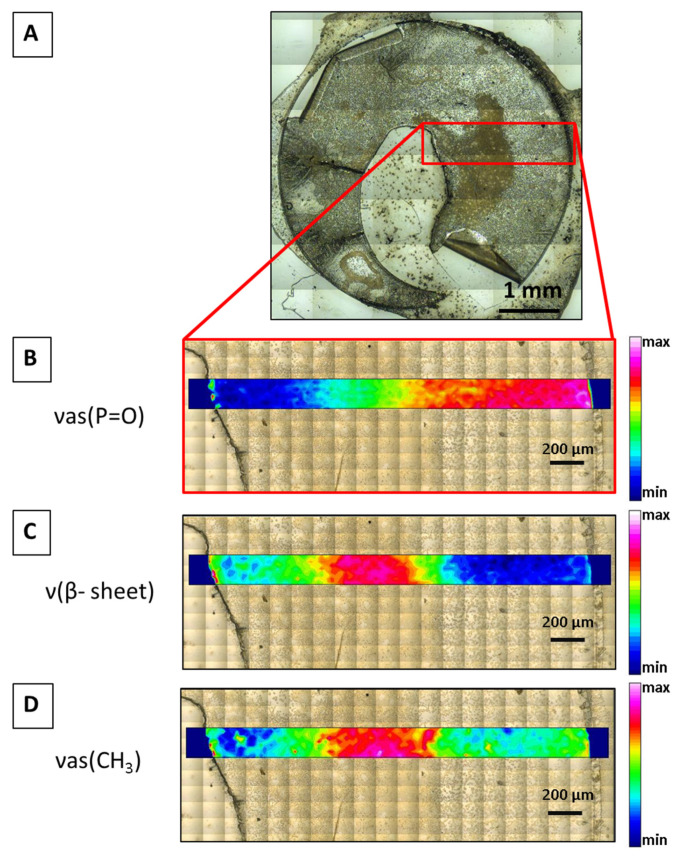
Figure 4.
(A) Visible image of a non-cataractous LC 3, C, and Ba taken in reflection geometry. Highlighted is the FTIR imaging area. Visible images with higher magnification achieved in transmission geometry are shown below with overlapped chemical FTIR micro-spectroscopy images showing the integrated intensities of the vas (P=O) band at 1238 cm−1 (B), the β-sheet contribution at 1625 cm−1 (C), and the vas (CH3) at 2960 cm−1 (D).

