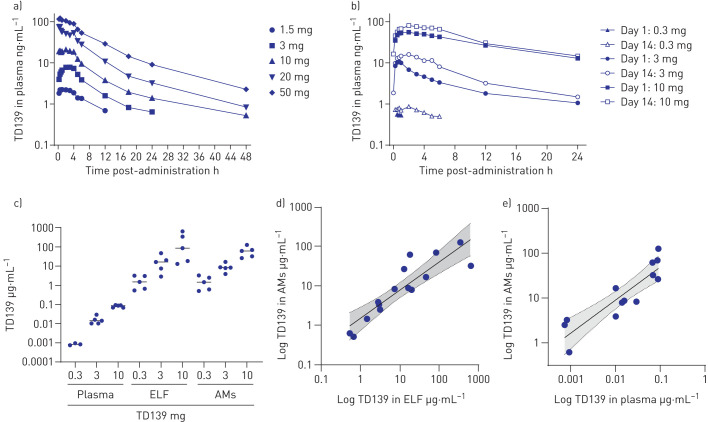
FIGURE 2.
TD139 pharmacokinetics in healthy subjects and idiopathic pulmonary fibrosis (IPF) patients. ELF: epithelial lining fluid; AM: alveolar macrophage. a) Healthy subjects: log-linear mean plasma concentration of TD139 versus time over 48 h following a single dose of drug. b) IPF patients: log-linear mean plasma concentration of TD139 versus time over 24 h following the first dose of drug on day 1 or the last dose on day 14. c) Log-linear individual measured concentrations (median) in plasma (total), ELF and AMs at 2 h post-administration of 0.3, 3 and 10 mg TD139 on day 14. d) Correlation between concentrations of TD139 in ELF and AMs for all active cohorts on day 14 (r=0.89 (95% CI 0.70–0.96); p<0.0001). e) Correlation between concentrations of TD139 in plasma (total) and AMs for all active cohorts on day 14 (r=0.89 (95% CI 0.65–0.96); p<0.0001). Shading represents 95% CI of the linear fit.

