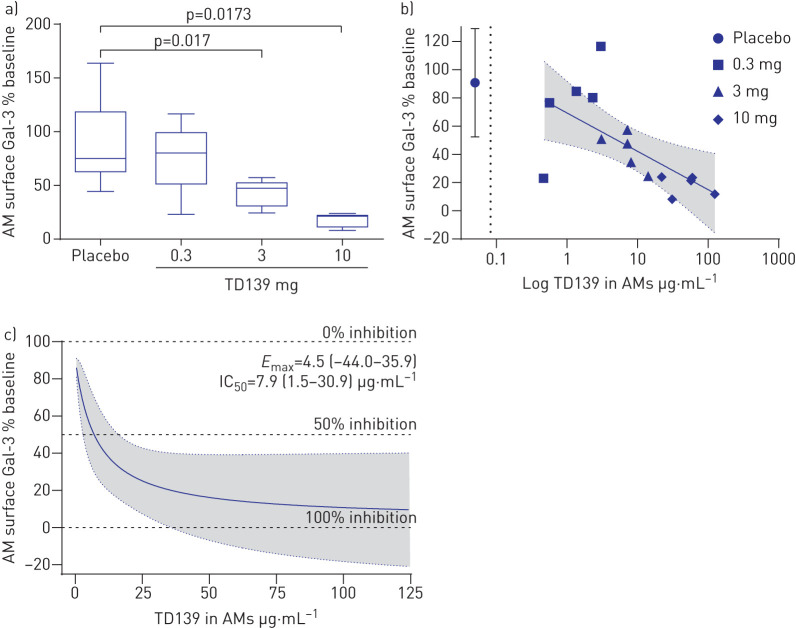
FIGURE 3.
Galectin (Gal)-3 changes in alveolar macrophages (AMs). a) Box plot of TD139 dose-dependent effect on percentage change from baseline in surface macrophage Gal-3 levels. Boxes indicate median and interquartile range; whiskers indicate minimum–maximum range. p-value from ANCOVA model adjusted for baseline. b) Concentration-dependent effect between TD139 in AMs and percentage of baseline in surface macrophage Gal-3, with maximum plasma concentration (Cmax) at 10 mg dose (dotted line) shown for comparison (r= −0.63 (95% CI −0.86– −0.18); p=0.011). Shading represents 95% CI of the linear fit. Individual subject data are labelled by dose. c) Fitted maximum effect model of surface macrophage Gal-3 (percentage of baseline) versus macrophage TD139 concentration. Maximum effect (Emax, AM surface Gal-3 percentage of baseline) and median inhibitory concentration (IC50) values are shown. Shading represents 95% CI of the fitted maximum effect model.

