Figure 2.
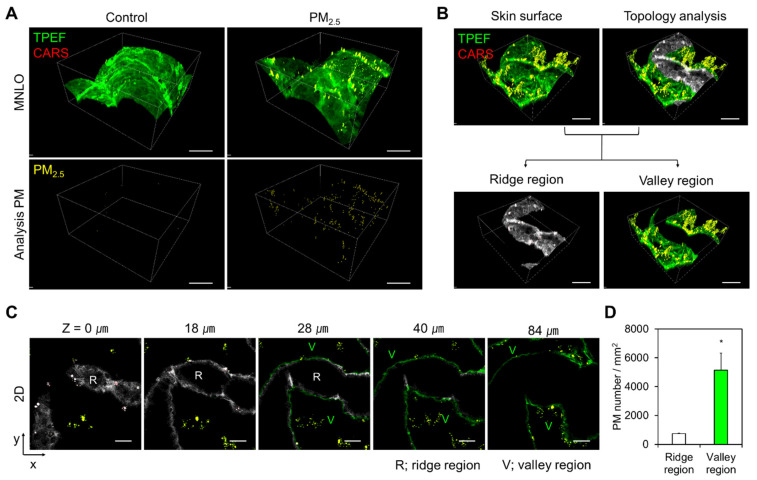
En face MNLO 3D imaging of PM2.5 in human skin biopsy samples. (A) En face MNLO images of the label-free stratum corneum (TPEF, green) and PM2.5 (CARS, red in the upper panels and yellow in the lower panels) in human skin biopsy samples after PM2.5 exposure. Consecutive en face MNLO image slices were reconstructed in 3D. The measurement volume was 420 (x) × 420 (y) × 200 (z) μm3. Scale bars, 100 μm. (B) Topological analysis of the en face MNLO 3D images. Ridge and valley regions of the skin microrelief are indicated in gray and green, respectively. Scale bars, 100 μm. (C) En face MNLO image slices from indicated z-depths after topological analysis. Scale bars, 60 μm. (D) Number of PM2.5 particles in the ridge and valley regions of the skin microrelief (mean ± S.E.M., * p < 0.05; two-tailed Student’s t-test).

