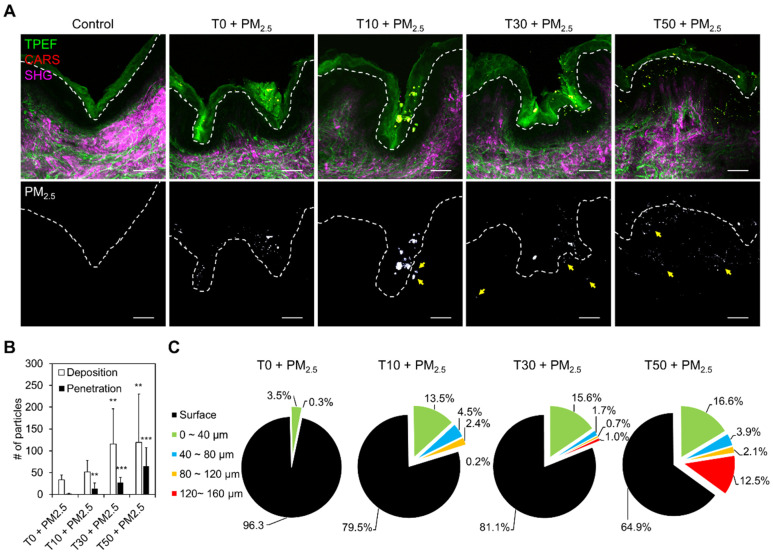
Figure 4.
Analysis of PM2.5 penetration by skin barrier disruption. (A) MNLO images of label-free elastin and keratin (TPEF, green), PM2.5 (CARS, red), and collagen (SHG, magenta) in cross-sectioned PM2.5-exposed human skin biopsy samples after tape-stripping (T). The dashed lines mark the boundary between the stratum corneum and the stratum spinosum. Scale bars, 60 μm. (B) Number of PM2.5 particles deposited or penetrated in the cross-sectioned samples (mean ± S.E.M., ** p < 0.01, *** p < 0.001; two-tailed Student’s t-test). (C) PM2.5 penetration depths by number of strippings, from measuring the distance between the penetrated PM2.5 and the dashed lines.

