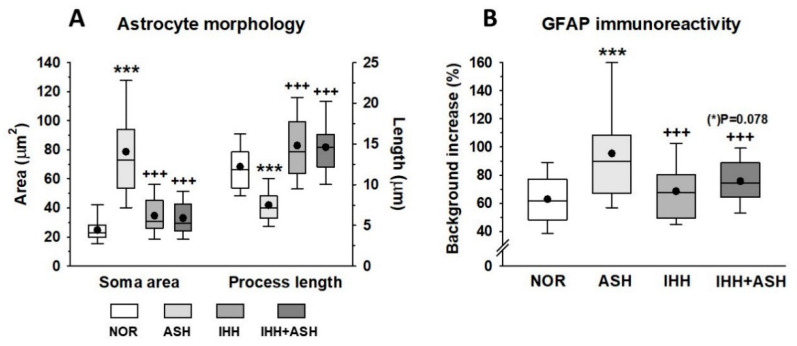
Figure 5.
(A) Astrocyte morphometrical parameters (soma area and process length morphology). (B) expression of astrocyte glial fibrillary acidic protein (GFAP) immunoreactivity. All data were obtained in the Cornu ammonis (CA1) hippocampal zone. The box represents the interquartile range in the box-and-whisker plots and shows the first and third quartiles separated by the median. The black dot represents the mean, and whisker endpoints represent the minimum and maximum values. Statistically significant differences between groups are presented with asterisks (*, vs. NOR) or crosses (+, vs. ASH). The three symbols indicate p < 0.001. F-values after running one-way ANOVAs with Bonferroni’s post hoc multiple comparison tests were: F = 85.94 (soma area), F = 119.93 (process length) and F = 20.77 (GFAP immunoreactivity). Animal experimental groups are abbreviated as NOR, normoxic; ASH, acute severe hypoxia; IHH, intermittent hypobaric hypoxia; IHH+ASH, intermittent hypobaric hypoxia followed by acute severe hypoxia.

