Figure 3.
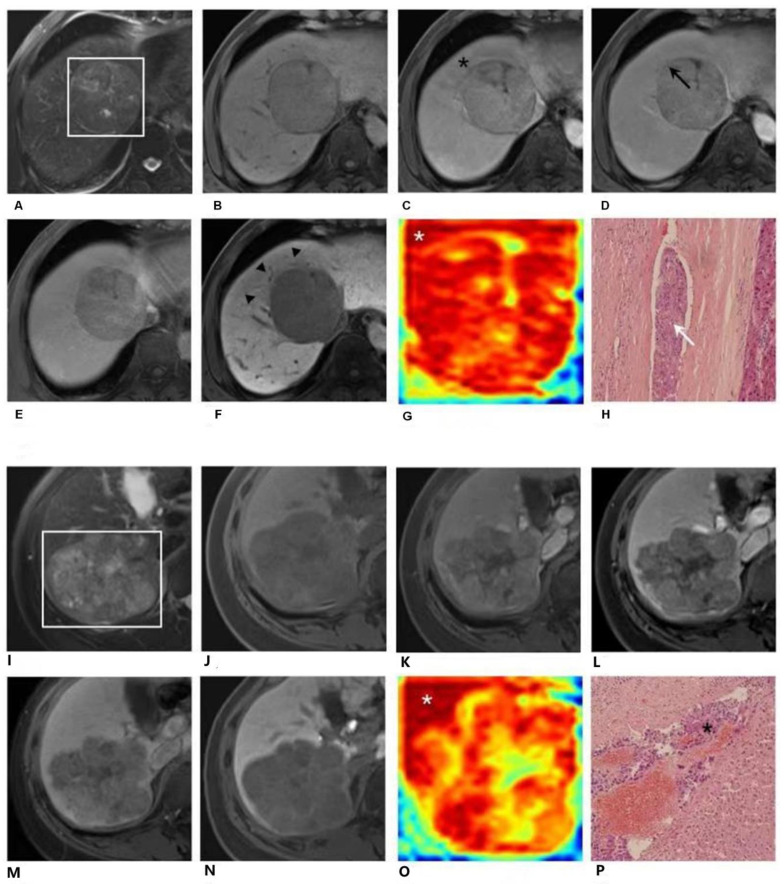
EOB-MRI images and EOB-MRI-based attention map. 3-1. Gadoxetic acid (EOB)-enhanced MR images (A–F) and the attention map (G) of a 57-year-old male patient. A 7.0 cm hepatocellular carcinoma (HCC) with histopathologically proven microvascular invasion (MVI) was detected in segment VIII. A distinctive high-risk area was detected on the attention map (G) along the tumor’s periphery (white star). This high-risk area could be confirmed radiologically by peritumoral enhancement (black star) of the arterial phase image (C), by interrupted capsule (black arrow) on the portal venous phase image (D) and by peritumoral hypointensity (F, black arrowhead) on the hepatobiliary phase image (G). However, it was not captured on T2-weighted (A), T1-weighted pre-contrast (B), or transitional phase (E) images. This high-risk area was proved as MVI-positive by postoperative histopathologic examination with hematoxylin eosin (HE) staining at 100× magnification (H, white arrow). EOB-MR images (I–P) and the attention map (O) of a 51-year-old female patient. An 8.6cm HCC with a histopathologically proven MVI was detected in segments VI and VII. A distinctive high-risk area was detected on the attention map (O) along the tumor periphery (white star). However, this high-risk area was not captured on T2-weighted (I), T1-weighted pre-contrast (J), arterial phase (K), portal venous phase (L), transitional phase (M) or hepatobiliary phase (N) images. This high-risk area was proved as MVI-positive by postoperative histopathologic examination with hematoxylin eosin (HE) staining at 100× magnification (P, black star).

