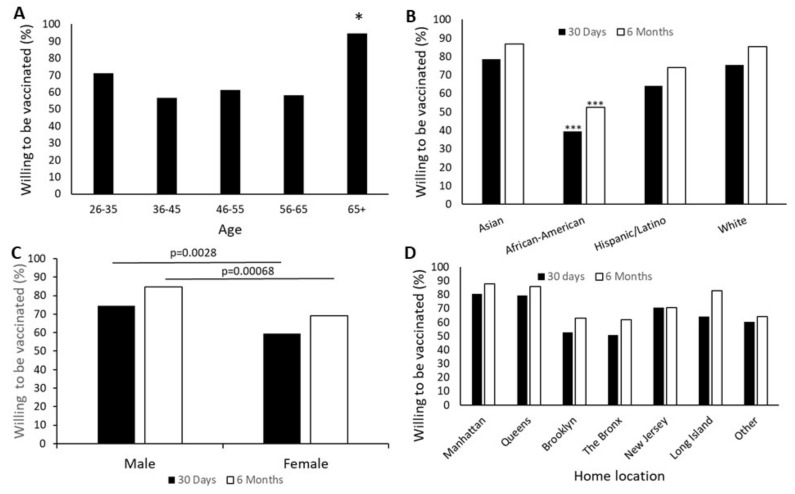
Figure 1.
Demographic influences on vaccine acceptance. Willingness to be vaccinated was evaluated using the questions “In the next 30 days…” or “In the next 6 months…” with responses being “I plan to vaccinate myself” or “I will not vaccinate myself.” (A) Significantly more subjects over the age of 65 were planning to be vaccinated within 30 days than any other group (Overall, χ2 = 14.65, p = 0.005, comparison of 65+ to each other group (*) p < 0.030). This difference disappeared when the time frame was extended to six months. (B) African American participants were significantly less likely to plan on vaccination than any other ethnic group within either 30 days or six months (*** p < 0.0003), (C) Women were less likely than men to accept vaccination within either time frame (p < 0.001). (D) Location of a person’s home was statistically meaningful in COVID-19 vaccination intention during both time frames (χ2 > 26, p < 0.0003). n = 428.

