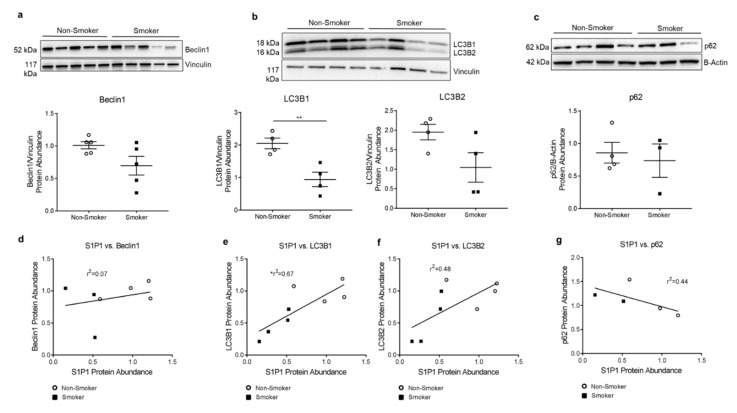
Figure 4.
Autophagy in HLMVECs from Smokers. (a–c) Representative Western blot and densitometry analysis with vinculin (a,b) or actin (c) as loading control in non-smoker and smoker HLMVECs of (a) beclin1 abundance, 25 µg (p = 0.07); (b) LC3B1 and LC3B2, 20 µg protein per well (** p = 0.007. LC3B2 p = 0.078.); (c) p62, 20 µg protein per well (p = 0.69). All graphs (a–c) show data points, each representing an individual donor; horizontal lines are mean ± SEM. Two-tailed unpaired Student’s t-test used for statistical analysis. (d–g) Correlations between (d) S1P1 and beclin1. r2 = 0.07; p = 0.55. (e) S1P1 and LC3B1. r2 = 0.67; * p = 0.01. (f) S1P1 and LC3B2. r2 = 0.48; p = 0.06. (g) S1P1 and p62. r2 = 0.44; p = 0.22. All graphs (d–g) show data points, each representing an individual donor. Only HLMVECs which were matched by donor and passage number were included in correlation analysis. Each densitometry value was first normalized to the average control (non-smoker) densitometry obtained from its respective Western blot. Pearson’s correlation coefficients with two-tailed p-values used for statistical analyses.

