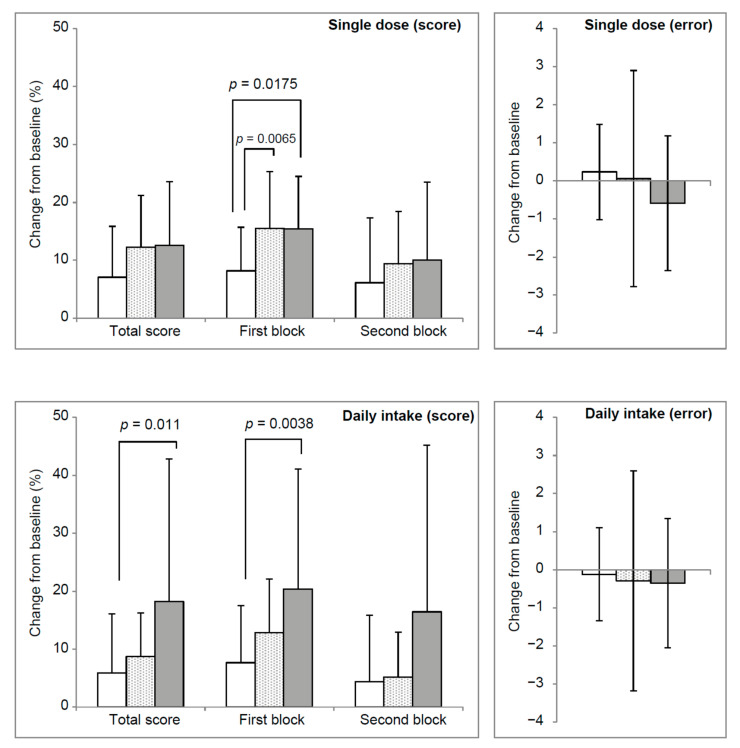
Figure 2.
Number of answers and errors during a mild acute stress task and intake of matcha or caffeine. Shown are the placebo group (white bar), caffeine group (shadow bar), and matcha group (grey bar). Each bar shows the mean ± standard deviation. Group (inter) analysis was performed using the Kruskal–Wallis test (KW) followed by a post-hoc Mann–Whitney U test at each time point to test for inter-group outcomes (control vs. caffeine, control vs. matcha, and caffeine vs. matcha). The p-value was determined using a Bonferroni correction of p < 0.05/3 = 0.017; p < 0.01/3 = 0.0033 vs. placebo group.

