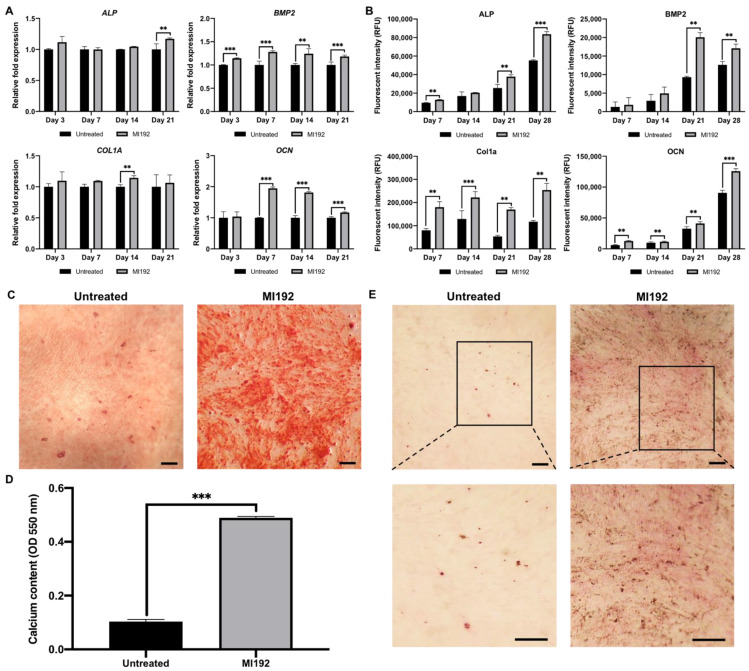
Figure 6.
The effects of MI192 pre-treatment (2 μM MI192 for 48 h) on hDPSCs osteogenic differentiation and mineralisation. Osteoblast-related (A) gene expression, (B) protein production, (C,D) calcium deposition (scale bar = 100 µm)) (day 28) and (E) mineral nodule formation (day 28) (scale bar = 50 µm). Data are expressed as mean ± SD (n = 3). ** p ≤ 0.01 and *** p ≤ 0.001.

