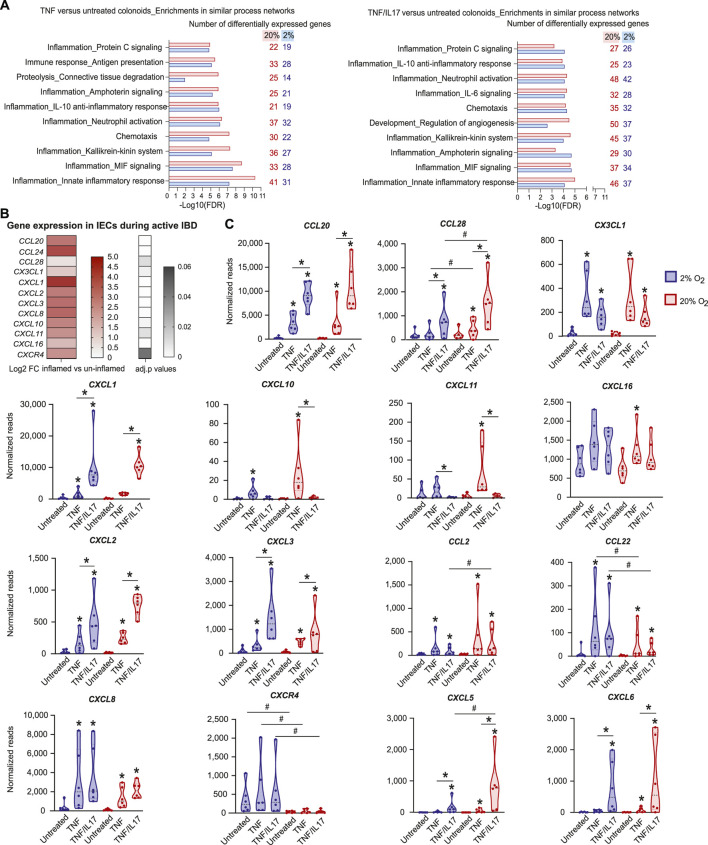
FIGURE 2.
Effects of TNF and IL17 on inflammation-related genes in colonoids at 20% or 2% O2 (A) Enrichment analysis of RNA-Seq data from colonoids after treatment with TNF or TNF/IL17 compared to untreated control at 20% or 2% O2. Gene ontology (GO) networks strongly associated with the differentially regulated genes (adjusted p values are all <0.05) are shown, with bars illustrating the statistical significance of the association (−Log10 false discovery rate (FDR)). The numbers of genes associated with the GO networks at 20% or 2% O2 are listed on the right. Enrichment analyses were performed using MetaCore™ version 6.34 build 69200 (Supplementary Data Sheet 2) (B) Upregulated chemokine and chemokine receptor genes in microdissected colonic epithelium from active IBD (n = 12) compared to uninflamed epithelium (healthy controls and IBD in remission, n = 17) shown as Log2 fold change (heatmap with upregulated genes) and adjusted p values (gray scale) (C) Chemokine gene expression in colonoids from six donors, treated with TNF or TNF/IL17 for 24h in 2 and 20% O2. Examples of significantly (p < 0.05) regulated chemokines and receptors are shown, determined using LIMMA linear models with least squares regression and empirical Bayes moderated t-statistics with Benjamini Hochberg false discovery rate correction for multiple comparisons (B,C). * without lines show significant alterations due to drug-target treatments when compared to untreated controls whereas * above lines show significant comparisons made between TNF and TNF/IL17. # above lines show significant differences between 2% oxygen and 20% O2 within a specific treatment condition.

