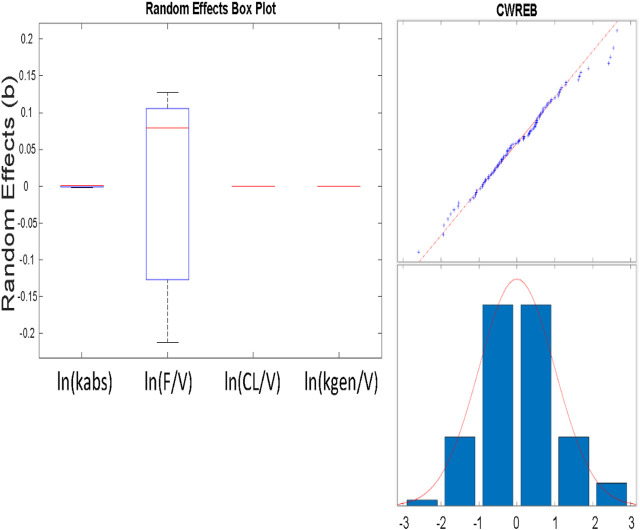
FIGURE 6.
A) (above) Box and whisker plot of estimated parameters from population fit. Most variability is in the F/VD parameter. B) (at right) Plot of residuals to evaluate normality using a combined (constant plus proportional) error model. The combined model gave improved normality in the “tails” at both low and high values shown here, as opposed to a constant error model.

