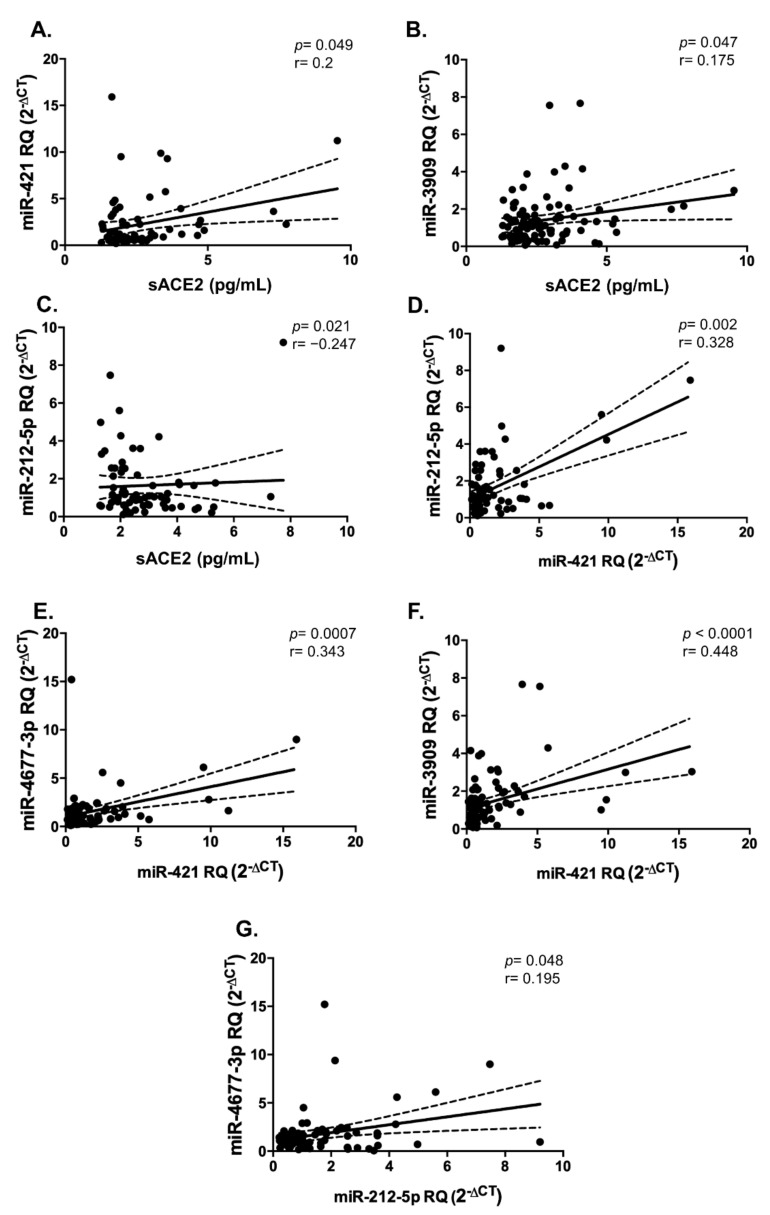
Figure 6.
Correlation analyses between sACE2 and 4 serum miRNAs. There were significant positive correlations between (A) miR-421 and sACE2, (B) miR-3909 and sACE2, and a significant negative correlation between (C) miR-212-5p and sACE2, respectively. Also, there was a positive correlation between (D) miR-212-5p and miR-421, (E) miR-4677-3p and miR-421, (F) miR-3909 and miR-421, and (G) miR-4677-3p and miR-212-5p, respectively. Dashed lines represent 95% confidence intervals.

